
AI 3D Game of Life - Conway's Automata in Space (Remix)

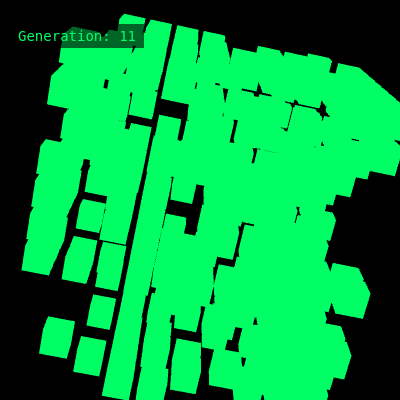
This sketch implements Conway's Game of Life in a 3D space using a 10×10×10 grid of cells. Live cells appear as rotating green boxes, and the automaton evolves each frame based on 3D neighbor rules, creating an ever-shifting pattern of emergence and decay.

🧪 Try This!

Experiment with the code by making these changes:

  1. Change grid size to 5×5×5 — Smaller grids compute faster and show simpler patterns, making it easier to see individual cells evolve
  2. Make cells bigger and farther apart — Larger cell size makes the structure more visible and easier to follow as it rotates
  3. Freeze the rotation completely — Removes rotation so you can see the grid structure clearly without motion, making patterns easier to understand
  4. Make the grid evolve instantly (every frame) — Changes from evolving every 15 frames to evolving every frame, speeding up the pattern dynamics dramatically
  5. Draw spheres instead of boxes — Changes the visual appearance from cubic cells to spheres, giving a softer organic look to the automaton
  6. Start with a denser population (50% alive) — Makes the initial grid much more crowded, creating wilder emergent patterns and often reaching stable structures faster
Prefer the full editor? Open it there →

📖 About This Sketch

This sketch brings Conway's classic Game of Life into three dimensions. Instead of a 2D grid, cells occupy a 10×10×10 cube that continuously rotates in 3D space. Living cells are drawn as bright green boxes, and each frame the entire population evolves according to rules based on how many neighbors each cell has in 3D—creating organic, pulsing patterns that feel almost alive.

The code demonstrates three powerful p5.js techniques: 3D rendering with WEBGL and rotateX/rotateY, spatial data structures using a linear array to represent a 3D grid, and the classic cellular automaton algorithm adapted for three dimensions. By reading it, you'll learn how to organize complex spatial data, apply Conway's rules to a new dimension, and create mesmerizing rotating visualizations.

⚙️ How It Works

  1. When the sketch loads, setup() creates a WEBGL canvas (which enables 3D drawing) and initializes two 1000-element arrays to represent the 10×10×10 grid—one for the current generation and one for the next generation. The grid is randomly populated so about 30% of cells are alive.
  2. On every frame, draw() clears the background to black and continuously rotates the entire view around the X and Y axes using rotateX() and rotateY(). It then loops through every cell in the grid and draws a green box for each living cell at its 3D position.
  3. Every 15 frames, the step() function runs: it examines each cell and counts how many of its 26 3D neighbors (surrounding cells in all directions including diagonals) are alive. A live cell survives only if it has 4-6 neighbors; a dead cell becomes alive only if it has 5-6 neighbors. These rules keep patterns from growing chaotically while allowing structures to emerge.
  4. After applying the rules, the grid and next arrays swap so the new generation becomes the current one, and the generation counter increments. Clicking anywhere on the canvas calls randomize() to reset to a fresh random pattern.

🎓 Concepts You'll Learn

3D arrays and indexingCellular automataWEBGL 3D renderingNeighbor counting algorithmsState management3D transforms (rotate, translate)

📝 Code Breakdown

idx(x, y, z)

This is a helper function that solves a key problem in spatial programming: JavaScript arrays are 1D, but we think in 3D. The formula x + N * (y + N * z) is the standard way to map any 3D coordinate to a unique 1D position. Understanding this is essential for working with grids in any dimension.

function idx(x, y, z) { return x + N * (y + N * z); }
Line-by-line explanation (1 lines)
return x + N * (y + N * z);
Converts 3D coordinates (x, y, z) into a single 1D array index. Since JavaScript arrays are 1D, this formula linearizes the 3D grid: the z-layer is multiplied by N², then the y-row by N, then x is added. This lets us store a 3D cube in a 1D array.
setup()

setup() runs once when the sketch starts. For 3D sketches, the key step is passing WEBGL as the third argument to createCanvas—without it, 3D functions won't work.

function setup() {
  createCanvas(windowWidth, windowHeight, WEBGL);
  grid = new Array(N * N * N); next = new Array(N * N * N);
  randomize();
  counterP = createP(''); counterP.id('counter');
}
Line-by-line explanation (4 lines)
createCanvas(windowWidth, windowHeight, WEBGL);
Creates a canvas that fills the entire window and enables WEBGL mode, which unlocks 3D drawing functions like box(), rotateX(), and rotateY().
grid = new Array(N * N * N); next = new Array(N * N * N);
Creates two arrays, each with 1000 elements (10×10×10). 'grid' stores the current generation's state, and 'next' will store the next generation as it's computed. We need two to avoid overwriting cells before we finish reading them.
randomize();
Calls the randomize function to populate the grid with a random initial state.
counterP = createP(''); counterP.id('counter');
Creates an empty HTML paragraph element and assigns it the id 'counter' so CSS can style it. This will display the generation number on screen.

randomize()

This function resets the grid to a random state. It's called once in setup() and again every time you click the canvas via mousePressed().

function randomize() {
  for (let i = 0; i < grid.length; i++) grid[i] = random() < 0.3;
}
Line-by-line explanation (1 lines)

🔧 Subcomponents:

for-loop Random cell initialization for (let i = 0; i < grid.length; i++) grid[i] = random() < 0.3;

Loops through every cell in the grid and randomly sets it to true (alive) with 30% probability or false (dead) otherwise

for (let i = 0; i < grid.length; i++) grid[i] = random() < 0.3;
Iterates through all 1000 cells. For each one, random() returns a number between 0 and 1. If it's less than 0.3 (30% chance), the cell becomes true (alive); otherwise it becomes false (dead). This creates a random but sparse starting pattern.

draw()

draw() is where all rendering happens in p5.js. Notice the pattern: clear the canvas (background), set colors and styles, apply transforms (rotations, translations), then draw shapes. The code uses push/pop to manage transformation state carefully so each cell draws at the right position.

🔬 This triple-nested loop draws a box for every living cell. What happens if you change box(S * 0.8) to sphere(S * 0.8)—do the cells become spheres instead of boxes?

  for (let z = 0; z < N; z++) for (let y = 0; y < N; y++) for (let x = 0; x < N; x++) {
    if (grid[idx(x, y, z)]) { push(); translate(x * S, y * S, z * S); box(S * 0.8); pop(); }
  }

🔬 This line only evolves the grid every 15 frames. What if you change the number from 15 to 5—how much faster does the pattern evolve and change?

  if (frameCount % 15 == 0) step();
  counterP.html('Generation: ' + gens);
function draw() {
  background(0); noStroke(); fill(0, 255, 100);
  angle += 0.01; rotateX(angle * 0.7); rotateY(angle);
  translate(-S * (N - 1) / 2, -S * (N - 1) / 2, -S * (N - 1) / 2);
  for (let z = 0; z < N; z++) for (let y = 0; y < N; y++) for (let x = 0; x < N; x++) {
    if (grid[idx(x, y, z)]) { push(); translate(x * S, y * S, z * S); box(S * 0.8); pop(); }
  }
  if (frameCount % 15 == 0) step();
  counterP.html('Generation: ' + gens);
}
Line-by-line explanation (9 lines)

🔧 Subcomponents:

calculation 3D rotation increments angle += 0.01; rotateX(angle * 0.7); rotateY(angle);

Continuously increments the rotation angle and applies it to rotate the entire 3D view around the X and Y axes

calculation Grid centering translation translate(-S * (N - 1) / 2, -S * (N - 1) / 2, -S * (N - 1) / 2);

Moves the origin so the grid rotates around its own center rather than the canvas origin

for-loop Cell rendering loop for (let z = 0; z < N; z++) for (let y = 0; y < N; y++) for (let x = 0; x < N; x++) {

Iterates through every cell coordinate in 3D space

conditional Draw live cells if (grid[idx(x, y, z)]) { push(); translate(x * S, y * S, z * S); box(S * 0.8); pop(); }

For each living cell, saves the current transformation state, moves to that cell's 3D position, draws a box, and restores the state

conditional Evolution step trigger if (frameCount % 15 == 0) step();

Every 15 frames, advances the automaton to the next generation

background(0); noStroke(); fill(0, 255, 100);
Clears the canvas to black each frame, disables shape outlines, and sets the fill color to bright neon green (RGB: 0, 255, 100)
angle += 0.01;
Increments a global angle variable by 0.01 each frame. Since draw() runs ~60 times per second, this creates smooth continuous rotation.
rotateX(angle * 0.7); rotateY(angle);
Applies two 3D rotations to the entire scene: one around the X-axis (vertical spindle) at 0.7× the angle, and one around the Y-axis at full angle. This makes the grid spin on two axes simultaneously.
translate(-S * (N - 1) / 2, -S * (N - 1) / 2, -S * (N - 1) / 2);
Shifts the drawing origin to the center of the grid. Without this, the grid would rotate around the corner (0,0,0) instead of around its center. The formula -S * (N - 1) / 2 calculates half the grid's total size in each dimension.
for (let z = 0; z < N; z++) for (let y = 0; y < N; y++) for (let x = 0; x < N; x++) {
Three nested loops that iterate through all 1000 cells in order: outer loop advances z (depth), middle loop advances y (height), inner loop advances x (width).
if (grid[idx(x, y, z)]) {
Checks if the cell at coordinates (x, y, z) is alive (true) in the grid.
push(); translate(x * S, y * S, z * S); box(S * 0.8); pop();
Saves the current transformation state (push), moves to this cell's 3D position, draws a box with side length 0.8×S, then restores the previous state (pop). This ensures each cell is drawn at the correct location without interfering with other cells.
if (frameCount % 15 == 0) step();
frameCount is a p5.js variable that increments every frame. The modulo operator % checks if it's divisible by 15—if so, the automaton steps to the next generation. This makes evolution happen every 15 frames instead of every frame.
counterP.html('Generation: ' + gens);
Updates the HTML paragraph element to display the current generation number.

step()

This is the heart of the automaton—the algorithm that computes the next generation. It's structured in three phases: iterate all cells, for each cell count its 3D neighbors while respecting boundaries, then apply the rules. The key insight is using a separate 'next' array so we read the old generation while writing the new one, preventing cells from influencing their own state calculation.

🔬 This loop counts all 26 living neighbors by checking each direction. What happens if you change the boundary check from nx < N to nx < N + 1 (remove that boundary check)? Will the grid wrap around edges?

    for (let dz = -1; dz <= 1; dz++) for (let dy = -1; dy <= 1; dy++) for (let dx = -1; dx <= 1; dx++) {
      if (dx || dy || dz) {
        let nx = x + dx, ny = y + dy, nz = z + dz;
        if (nx >= 0 && nx < N && ny >= 0 && ny < N && nz >= 0 && nz < N && grid[idx(nx, ny, nz)]) n++;
      }
    }
function step() {
  for (let z = 0; z < N; z++) for (let y = 0; y < N; y++) for (let x = 0; x < N; x++) {
    let n = 0, i = idx(x, y, z);
    for (let dz = -1; dz <= 1; dz++) for (let dy = -1; dy <= 1; dy++) for (let dx = -1; dx <= 1; dx++) {
      if (dx || dy || dz) {
        let nx = x + dx, ny = y + dy, nz = z + dz;
        if (nx >= 0 && nx < N && ny >= 0 && ny < N && nz >= 0 && nz < N && grid[idx(nx, ny, nz)]) n++;
      }
    }
    next[i] = grid[i] ? (n >= 4 && n <= 6) : (n >= 5 && n <= 6);
  }
  [grid, next] = [next, grid]; gens++;
}
Line-by-line explanation (8 lines)

🔧 Subcomponents:

for-loop Main cell iteration loop for (let z = 0; z < N; z++) for (let y = 0; y < N; y++) for (let x = 0; x < N; x++) {

Outer loop that examines every cell in the grid

for-loop 3D neighbor enumeration for (let dz = -1; dz <= 1; dz++) for (let dy = -1; dy <= 1; dy++) for (let dx = -1; dx <= 1; dx++) {

Inner loop that checks all 26 neighbors (3×3×3 cube minus the center cell)

conditional Skip center cell if (dx || dy || dz) {

Skips the center cell (0,0,0) so we only count neighbors, not the cell itself

conditional Boundary wrapping check if (nx >= 0 && nx < N && ny >= 0 && ny < N && nz >= 0 && nz < N && grid[idx(nx, ny, nz)]) n++;

Ensures neighbor coordinates are within bounds (the grid doesn't wrap), then increments the neighbor count if that neighbor is alive

calculation 3D Conway's rules application next[i] = grid[i] ? (n >= 4 && n <= 6) : (n >= 5 && n <= 6);

Determines the cell's next state: live cells survive with 4-6 neighbors, dead cells are born with 5-6 neighbors

calculation Generation swap [grid, next] = [next, grid]; gens++;

Swaps grid and next so the newly computed generation becomes the current one, and increments the generation counter

let n = 0, i = idx(x, y, z);
Initializes n to count neighbors and calculates i, the 1D array index for cell (x, y, z).
for (let dz = -1; dz <= 1; dz++) for (let dy = -1; dy <= 1; dy++) for (let dx = -1; dx <= 1; dx++) {
Three nested loops that iterate through all offset values from -1 to 1 for each dimension. This enumerates all 27 possible neighbors (including the center).
if (dx || dy || dz) {
Skips the case where all offsets are 0 (the center cell itself). The || operator means 'if any of dx, dy, dz is nonzero', effectively skipping the cell's own position.
let nx = x + dx, ny = y + dy, nz = z + dz;
Calculates the neighbor's coordinates by adding the offset to the current cell's position.
if (nx >= 0 && nx < N && ny >= 0 && ny < N && nz >= 0 && nz < N && grid[idx(nx, ny, nz)]) n++;
Checks that the neighbor is within grid bounds (not wrapping around edges), and if so, checks if that neighbor is alive. If both conditions are true, increments n.
next[i] = grid[i] ? (n >= 4 && n <= 6) : (n >= 5 && n <= 6);
Applies Conway's 3D rules: if the current cell is alive (grid[i] is true), it survives only if it has 4-6 neighbors; if dead, it's born only if it has 5-6 neighbors. The result is stored in next[i].
[grid, next] = [next, grid];
JavaScript array destructuring: swaps the two arrays so the newly computed next generation becomes the new grid.
gens++;
Increments the generation counter by 1.

mousePressed()

This function is automatically called by p5.js whenever the mouse is pressed. It provides user interactivity—clicking randomizes the pattern, letting you explore different evolutionary paths.

function mousePressed() { randomize(); gens = 0; }
Line-by-line explanation (2 lines)
randomize();
Calls randomize() to fill the grid with a new random pattern.
gens = 0;
Resets the generation counter to 0 so the counter display starts over.

windowResized()

This responsive design pattern ensures the sketch uses the full window space even if the user resizes their browser. Without it, the canvas would stay at its original size.

function windowResized() { resizeCanvas(windowWidth, windowHeight); }
Line-by-line explanation (1 lines)
resizeCanvas(windowWidth, windowHeight);
Automatically adjusts the canvas size to match the current window width and height. This function is called by p5.js whenever the browser window is resized.

📦 Key Variables

N number

The grid dimension—the grid is N×N×N cells (default 10, creating a 1000-cell cube)

let N = 10;
grid array

A 1000-element boolean array storing the current generation; grid[idx(x,y,z)] is true if that cell is alive

let grid = new Array(N * N * N);
next array

A 1000-element boolean array for computing the next generation; prevents overwriting cells before they're read

let next = new Array(N * N * N);
gens number

Tracks how many generations have elapsed, displayed in the counter on screen

let gens = 0;
angle number

A continuously incrementing rotation angle used to spin the grid in 3D space each frame

let angle = 0;
S number

The size (side length in pixels) of each cell's box—controls how spread out the grid appears

const S = 30;
counterP object

Stores a reference to the HTML paragraph element that displays the generation number

let counterP = createP('');

🔧 Potential Improvements (5)

Here are some ways this code could be enhanced:

PERFORMANCE draw() and step()

The nested triple loops in both draw() and step() iterate through all 1000 cells every frame, even if most are dead and never drawn. For a 12×12×12 grid this becomes 1728 cells checked every frame, significantly slowing performance.

💡 Maintain a Set or array of only live cell coordinates instead of checking every cell. After step(), update this set to contain only living cells. Then in draw(), loop only over live cells. This reduces iterations from N³ to the actual number of living cells.

BUG step() neighbor counting

The boundary check prevents wrapping, but the grid's edges become biologically dead zones—cells on boundaries can never accumulate enough neighbors to survive or be born. This creates an artificial 'shell' of permanent death around the grid.

💡 Implement toroidal wrapping (where edges wrap to opposite sides) for more authentic 3D Life: change nx = x + dx to nx = (x + dx + N) % N and similarly for ny and nz. This lets patterns at one edge continue naturally on the opposite edge.

STYLE step() function

The neighbor-counting logic and rule application are crammed into a single complex line: next[i] = grid[i] ? (n >= 4 && n <= 6) : (n >= 5 && n <= 6);. This is harder to read and modify than it should be.

💡 Extract the rules into a separate function: conwaySurvival(alive, neighbors) { return alive ? (neighbors >= 4 && neighbors <= 6) : (neighbors >= 5 && neighbors <= 6); }, then call it as next[i] = conwaySurvival(grid[i], n);. This makes the rules visible at a glance and easier to experiment with.

FEATURE User interaction

Currently there's no way to pause the evolution or step through generations manually—only randomize on click. Users can't study interesting patterns in detail.

💡 Add keyboard controls: pressing 'p' toggles pause/play, 'n' advances one generation while paused, 'r' randomizes. Display the current state (PLAY/PAUSED) on screen. This gives users fine-grained control over the simulation.

FEATURE Visualization

All live cells are the same bright green, making it hard to distinguish cells of different ages or regions.

💡 Color cells by their age or by their position in space. For example, use HSB color mode and set hue based on (x + y + z) / (3*N) to create a rainbow gradient across the grid, or track age and color newer cells brighter than older ones.

🔄 Code Flow

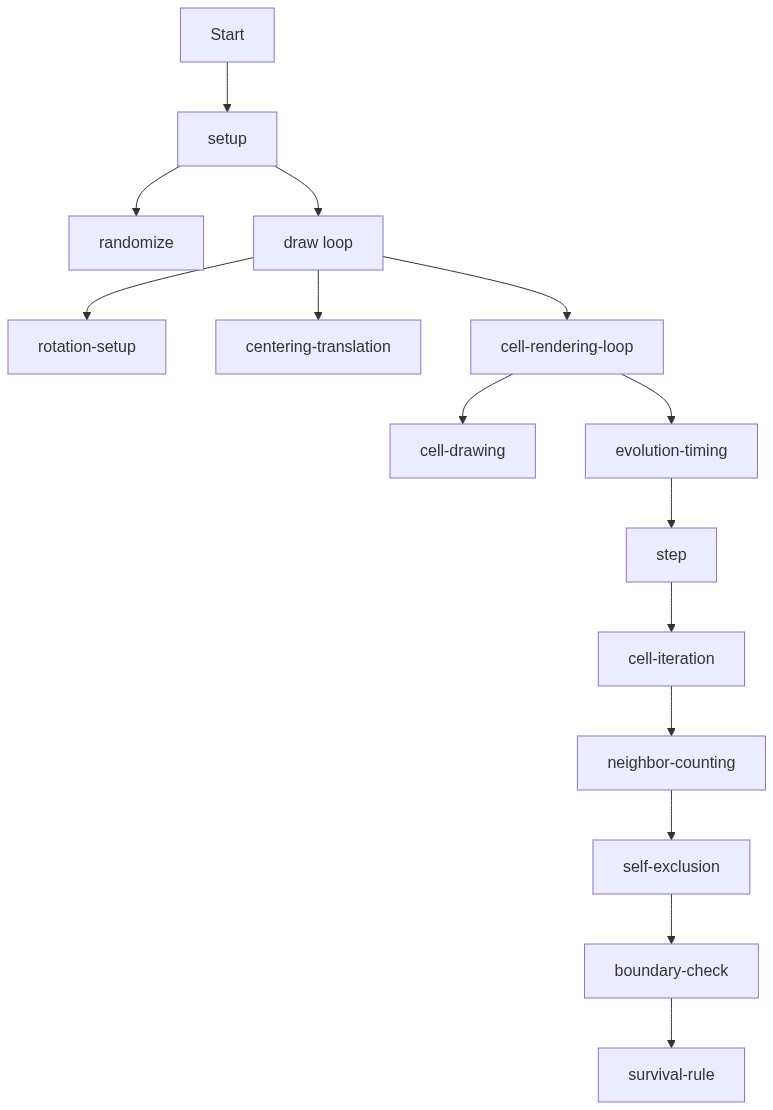
Code flow showing idx, setup, randomize, draw, step, mousepressed, windowresized

💡 Click on function names in the diagram to jump to their code

graph TD start[Start] --> setup[setup] setup --> randomize-loop[randomize-loop] randomize-loop --> randomize setup --> draw[draw loop] draw --> rotation-setup[rotation-setup] rotation-setup --> centering-translate[centering-translate] centering-translate --> triple-loop[triple-loop] triple-loop --> cell-draw[cell-draw] cell-draw --> evolution-trigger[evolution-trigger] evolution-trigger --> step[step] step --> main-cell-loop[main-cell-loop] main-cell-loop --> neighbor-counting-loop[neighbor-counting-loop] neighbor-counting-loop --> center-check[center-check] center-check --> bounds-check[bounds-check] bounds-check --> conway-rules[conway-rules] conway-rules --> grid-swap[grid-swap] grid-swap --> main-cell-loop click setup href "#fn-setup" click randomize-loop href "#sub-randomize-loop" click randomize href "#fn-randomize" click draw href "#fn-draw" click rotation-setup href "#sub-rotation-setup" click centering-translate href "#sub-centering-translate" click triple-loop href "#sub-triple-loop" click cell-draw href "#sub-cell-draw" click evolution-trigger href "#sub-evolution-trigger" click step href "#fn-step" click main-cell-loop href "#sub-main-cell-loop" click neighbor-counting-loop href "#sub-neighbor-counting-loop" click center-check href "#sub-center-check" click bounds-check href "#sub-bounds-check" click conway-rules href "#sub-conway-rules" click grid-swap href "#sub-grid-swap"

❓ Frequently Asked Questions

What visual experience does the AI 3D Game of Life sketch provide?

The sketch creates a dynamic 3D visualization of Conway's Game of Life, where colorful boxes represent living cells in a three-dimensional grid that rotate and evolve over time.

How can users interact with the AI 3D Game of Life sketch?

Users can click on the canvas to randomize the initial state of the grid, resetting the simulation and starting a new generation cycle.

What coding concepts are showcased in the AI 3D Game of Life sketch?

The sketch demonstrates concepts of cellular automata, 3D rendering in p5.js, and how to implement rules for state changes in a grid-based system.

Preview

AI 3D Game of Life - Conway's Automata in Space (Remix) - p5.js creative coding sketch preview
Sketch Preview
Code flow diagram showing the structure of AI 3D Game of Life - Conway's Automata in Space (Remix) - Code flow showing idx, setup, randomize, draw, step, mousepressed, windowresized
Code Flow Diagram