
AI Cellular Automaton Lab - Conway's Game of Life Classic cellular automaton simulation! Click or d

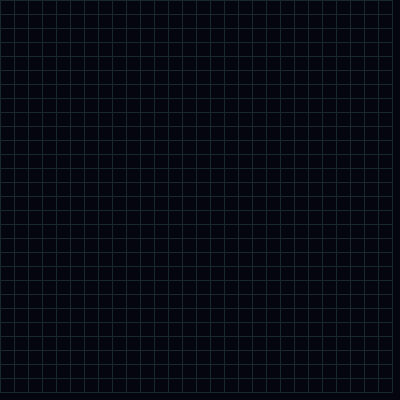
This sketch brings Conway's Game of Life to your browser as an interactive grid of neon-green cells on a dark background. You can click or drag to draw your own starting pattern, then press spacebar to watch it evolve generation by generation according to simple birth/death rules.

🧪 Try This!

Experiment with the code by making these changes:

  1. Recolor the living cells — The fill() call sets the color of every alive cell, so changing its RGB values instantly changes the whole simulation's color scheme.
  2. Shrink or grow the cells — Making cellSize smaller packs more cells into the same canvas for finer detail, while a bigger value creates a chunkier, more retro look.
  3. Start the simulation already running — Setting running to true means patterns you draw will animate immediately without needing to press spacebar first.
  4. Darken the grid lines to near invisibility — Lowering the stroke values makes the grid overlay blend almost completely into the background for a cleaner look.
Prefer the full editor? Open it there →

📖 About This Sketch

This sketch recreates Conway's Game of Life, the famous cellular automaton where a grid of cells lives, dies, or is born each generation based on how many neighbors it has. It renders a full-screen grid of neon-green squares on a dark canvas, lets you click or drag with the mouse to toggle cells on and off, and starts or pauses the simulation with the spacebar. Under the hood it relies on nested 2D arrays, nested for-loops for neighbor counting, and simple conditional rules to decide the fate of every cell.

The code is organized around two parallel grid arrays - one holding the current generation and one being written with the next generation - which get swapped every step so nothing overwrites itself mid-calculation. By studying it you'll learn how to build and traverse a 2D array in JavaScript, how to count neighbors around a cell without going out of bounds, how mouse and keyboard event functions plug into p5.js, and how windowResized() lets a sketch adapt to any screen size.

⚙️ How It Works

  1. When the sketch loads, setup() creates a canvas that fills the browser window and calls initGrid(), which calculates how many columns and rows of cells fit based on cellSize and builds two empty 2D arrays (grid and nextGrid) full of zeros.
  2. Every frame, draw() clears the background, and if the simulation is running it calls stepGameOfLife() to compute the next generation; then it calls drawCells() to paint every living cell and drawGridLines() to draw the faint grid overlay.
  3. stepGameOfLife() loops over every cell, counts its eight neighbors using a small nested loop, applies Conway's classic rules (a live cell with 2-3 neighbors survives, a dead cell with exactly 3 neighbors is born, everything else dies or stays dead), writes the result into nextGrid, and then swaps grid and nextGrid so the new generation becomes current.
  4. Clicking or dragging the mouse calls toggleCellAt(), which converts the mouse's pixel position into a column/row index and flips that cell between alive and dead, while tracking the last toggled cell so a single drag doesn't rapidly flicker one cell.
  5. Pressing spacebar calls keyPressed(), which flips the running boolean to start or pause the simulation, and returns false so the browser doesn't scroll the page.
  6. If the browser window is resized, windowResized() resizes the canvas and calls initGrid() again, rebuilding a fresh empty grid sized to the new dimensions.

🎓 Concepts You'll Learn

2D arraysNested for-loopsCellular automaton rulesMouse interaction (mousePressed/mouseDragged)Keyboard interaction (keyPressed)Grid-to-pixel coordinate mappingDouble buffering (swapping grids)Responsive canvas (windowResized)

📝 Code Breakdown

setup()

setup() runs once when the sketch starts. Here it's kept minimal - all the real grid-building logic lives in initGrid() so it can also be reused by windowResized().

function setup() {
  createCanvas(windowWidth, windowHeight); // https://p5js.org/reference/#/p5/createCanvas
  initGrid();
}
Line-by-line explanation (2 lines)
createCanvas(windowWidth, windowHeight);
Creates a canvas that fills the entire browser window, so the grid uses all available space.
initGrid();
Calls the helper function that calculates the grid dimensions and builds the two empty 2D arrays used for the simulation.
initGrid()

This function centralizes grid setup so it can be called both at startup and whenever the window is resized, avoiding duplicated code.

🔬 This determines the resolution of the grid. What happens visually if you divide by cellSize / 2 instead, effectively doubling cols and rows?

  cols = floor(width / cellSize);
  rows = floor(height / cellSize);
function initGrid() {
  cols = floor(width / cellSize);
  rows = floor(height / cellSize);

  grid = make2DArray(cols, rows, 0);
  nextGrid = make2DArray(cols, rows, 0);
}
Line-by-line explanation (4 lines)
cols = floor(width / cellSize);
Divides the canvas width by the pixel size of one cell and rounds down, giving the number of columns that fit.
rows = floor(height / cellSize);
Same calculation for the vertical direction, giving the number of rows.
grid = make2DArray(cols, rows, 0);
Builds the current-generation grid, filled entirely with 0 (dead cells) to start.
nextGrid = make2DArray(cols, rows, 0);
Builds a second same-sized grid that will be used to store the next generation's results during each simulation step.

make2DArray()

This is a reusable utility function that builds any-sized 2D array with a chosen default value - a common pattern for grid-based simulations.

🔬 What if instead of always using initialValue, you set arr[x][y] to a random 0 or 1? Try replacing the assignment with a random choice - what does the grid look like when it first loads?

  for (let x = 0; x < cols; x++) {
    arr[x] = new Array(rows);
    for (let y = 0; y < rows; y++) {
      arr[x][y] = initialValue;
    }
  }
function make2DArray(cols, rows, initialValue) {
  const arr = new Array(cols);
  for (let x = 0; x < cols; x++) {
    arr[x] = new Array(rows);
    for (let y = 0; y < rows; y++) {
      arr[x][y] = initialValue;
    }
  }
  return arr;
}
Line-by-line explanation (4 lines)

🔧 Subcomponents:

for-loop Column Loop for (let x = 0; x < cols; x++) {

Iterates over every column index to create a row-array for each column

for-loop Row Loop for (let y = 0; y < rows; y++) {

Fills every cell in the current column with the given initial value

const arr = new Array(cols);
Creates an outer array with one slot per column - this will hold an array of rows for each column.
arr[x] = new Array(rows);
For each column, creates a nested array to hold every row's value in that column.
arr[x][y] = initialValue;
Sets every cell to the initial value passed in (0 for dead), so the grid starts completely empty.
return arr;
Sends the finished 2D array back to whoever called this function (initGrid).

draw()

draw() runs continuously about 60 times per second. It's kept short here, delegating work to helper functions - a good pattern for keeping code organized as a sketch grows.

🔬 What if you called stepGameOfLife() twice inside this block? The simulation would advance two generations per frame - how would that change the perceived speed?

  if (running) {
    stepGameOfLife();
  }
function draw() {
  background(5, 5, 15); // dark background

  if (running) {
    stepGameOfLife();
  }

  drawCells();
  drawGridLines();
}
Line-by-line explanation (5 lines)

🔧 Subcomponents:

conditional Simulation Toggle if (running) {

Only advances the simulation to the next generation when the user has pressed spacebar to start it

background(5, 5, 15); // dark background
Repaints the whole canvas with a near-black color every frame, erasing the previous frame's drawing.
if (running) {
Checks the running boolean - the simulation only advances when this is true (toggled by spacebar).
stepGameOfLife();
Computes the next generation of cells according to Conway's rules.
drawCells();
Draws every currently-alive cell as a filled square.
drawGridLines();
Draws the faint grid lines on top so individual cells are visually distinguishable.

stepGameOfLife()

This function is the heart of the simulation, implementing Conway's four famous rules for cellular life using neighbor counting and double-buffered grids to avoid overwriting data mid-calculation.

🔬 These lines are the entire rulebook of Conway's Game of Life. What happens if you change 'neighbors === 3' (the birth rule) to 'neighbors === 2 || neighbors === 3'? Try it and see if patterns grow explosively.

      if (state === 1 && (neighbors < 2 || neighbors > 3)) {
        // Live cell dies
        nextGrid[x][y] = 0;
      } else if (state === 0 && neighbors === 3) {
        // Dead cell is born
        nextGrid[x][y] = 1;
      } else {
        // Otherwise stays the same
        nextGrid[x][y] = state;
      }
function stepGameOfLife() {
  for (let x = 0; x < cols; x++) {
    for (let y = 0; y < rows; y++) {
      const state = grid[x][y];
      let neighbors = 0;

      // Count live neighbors (no wrapping at edges)
      for (let i = -1; i <= 1; i++) {
        for (let j = -1; j <= 1; j++) {
          if (i === 0 && j === 0) continue;
          const nx = x + i;
          const ny = y + j;
          if (nx >= 0 && nx < cols && ny >= 0 && ny < rows) {
            neighbors += grid[nx][ny];
          }
        }
      }

      // Conway's Game of Life rules
      if (state === 1 && (neighbors < 2 || neighbors > 3)) {
        // Live cell dies
        nextGrid[x][y] = 0;
      } else if (state === 0 && neighbors === 3) {
        // Dead cell is born
        nextGrid[x][y] = 1;
      } else {
        // Otherwise stays the same
        nextGrid[x][y] = state;
      }
    }
  }

  // Swap grids
  const temp = grid;
  grid = nextGrid;
  nextGrid = temp;
}
Line-by-line explanation (15 lines)

🔧 Subcomponents:

for-loop Cell Iteration for (let x = 0; x < cols; x++) {

Visits every cell in the grid to compute its next state

for-loop Neighbor Counting for (let i = -1; i <= 1; i++) {

Checks all 8 surrounding cells (3x3 block minus the center) and sums how many are alive

conditional Skip Self if (i === 0 && j === 0) continue;

Prevents the cell from counting itself as one of its own neighbors

conditional Edge Bounds Check if (nx >= 0 && nx < cols && ny >= 0 && ny < rows) {

Makes sure neighbor coordinates are inside the grid so edges don't wrap or crash

conditional Conway's Rules if (state === 1 && (neighbors < 2 || neighbors > 3)) {

Applies the classic underpopulation/overpopulation/survival/birth rules to decide the cell's next state

calculation Grid Swap const temp = grid;

Swaps grid and nextGrid references so the newly computed generation becomes the current one without copying data

const state = grid[x][y];
Reads whether this cell is currently alive (1) or dead (0).
let neighbors = 0;
Starts a counter that will tally how many of the 8 surrounding cells are alive.
if (i === 0 && j === 0) continue;
Skips the center of the 3x3 block, since a cell isn't its own neighbor.
const nx = x + i;
Calculates the neighbor's column index by offsetting from the current cell.
const ny = y + j;
Calculates the neighbor's row index the same way.
if (nx >= 0 && nx < cols && ny >= 0 && ny < rows) {
Checks the neighbor coordinates are within the grid bounds, so cells at the edge don't look outside the array.
neighbors += grid[nx][ny];
Adds 1 to the neighbor count if that neighboring cell is alive (since alive cells store 1).
if (state === 1 && (neighbors < 2 || neighbors > 3)) {
Conway's rule: a live cell with fewer than 2 or more than 3 neighbors dies from under- or over-population.
nextGrid[x][y] = 0;
Marks this cell as dead in the next generation.
} else if (state === 0 && neighbors === 3) {
Conway's rule: a dead cell with exactly 3 live neighbors comes to life.
nextGrid[x][y] = 1;
Marks this cell as alive in the next generation.
nextGrid[x][y] = state;
Otherwise the cell's state carries over unchanged (a live cell with 2-3 neighbors survives; a dead cell without exactly 3 neighbors stays dead).
const temp = grid;
Saves a reference to the old grid temporarily.
grid = nextGrid;
Makes the freshly computed generation the new current grid.
nextGrid = temp;
Reuses the old grid array as storage space for the following generation, avoiding creating new arrays every frame.

drawCells()

This function translates the abstract grid data into visible pixels, showing the common pattern of multiplying a grid index by a cell size to get screen coordinates.

🔬 What if you shrink the rectangle slightly, like using cellSize - 2 for width and height? How does that change the look of the grid?

      if (grid[x][y] === 1) {
        rect(x * cellSize, y * cellSize, cellSize, cellSize); // https://p5js.org/reference/#/p5/rect
      }
function drawCells() {
  noStroke();
  fill(0, 255, 140); // neon green

  for (let x = 0; x < cols; x++) {
    for (let y = 0; y < rows; y++) {
      if (grid[x][y] === 1) {
        rect(x * cellSize, y * cellSize, cellSize, cellSize); // https://p5js.org/reference/#/p5/rect
      }
    }
  }
}
Line-by-line explanation (4 lines)

🔧 Subcomponents:

for-loop Cell Draw Loop for (let x = 0; x < cols; x++) {

Visits every grid cell and draws a square wherever the cell is alive

conditional Alive Check if (grid[x][y] === 1) {

Only draws a rectangle for cells that are currently alive, skipping dead ones

noStroke();
Turns off outlines so the squares are solid color with no border.
fill(0, 255, 140); // neon green
Sets the fill color to a bright neon green for all live cells.
if (grid[x][y] === 1) {
Checks whether this specific cell is alive before spending time drawing it.
rect(x * cellSize, y * cellSize, cellSize, cellSize); // https://p5js.org/reference/#/p5/rect
Draws a square at the cell's pixel position, converting grid coordinates (x, y) into screen coordinates by multiplying by cellSize.

drawGridLines()

This function demonstrates the classic 'pixel-perfect line' trick of offsetting coordinates by 0.5 to avoid anti-aliasing blur on thin 1px lines in HTML canvas rendering.

🔬 What if this loop only ran every 5th line, like 'for (let x = 0; x <= cols; x += 5)'? How would the grid look with fewer dividing lines?

  // Vertical lines
  for (let x = 0; x <= cols; x++) {
    line(x * cellSize + 0.5, 0, x * cellSize + 0.5, h);
  }
function drawGridLines() {
  stroke(25, 40, 40);
  strokeWeight(1);

  const w = cols * cellSize;
  const h = rows * cellSize;

  // Vertical lines
  for (let x = 0; x <= cols; x++) {
    line(x * cellSize + 0.5, 0, x * cellSize + 0.5, h);
  }

  // Horizontal lines
  for (let y = 0; y <= rows; y++) {
    line(0, y * cellSize + 0.5, w, y * cellSize + 0.5);
  }
}
Line-by-line explanation (6 lines)

🔧 Subcomponents:

for-loop Vertical Line Loop for (let x = 0; x <= cols; x++) {

Draws one vertical line per column boundary, including the far right edge

for-loop Horizontal Line Loop for (let y = 0; y <= rows; y++) {

Draws one horizontal line per row boundary, including the bottom edge

stroke(25, 40, 40);
Sets a dim, dark greenish-gray color for the grid lines so they're subtle against the background.
strokeWeight(1);
Makes the lines exactly 1 pixel thick.
const w = cols * cellSize;
Calculates the total pixel width of the grid so lines don't extend past the last column.
const h = rows * cellSize;
Calculates the total pixel height of the grid for the same reason.
line(x * cellSize + 0.5, 0, x * cellSize + 0.5, h);
Draws a vertical line at each column boundary; the +0.5 offset keeps 1px lines crisp instead of blurry.
line(0, y * cellSize + 0.5, w, y * cellSize + 0.5);
Draws a horizontal line at each row boundary using the same crisp-line trick.

mousePressed()

mousePressed() is a built-in p5.js event function that automatically runs once whenever a mouse button is clicked down.

function mousePressed() {
  toggleCellAt(mouseX, mouseY);
}
Line-by-line explanation (1 lines)
toggleCellAt(mouseX, mouseY);
Calls the helper function with the current mouse position to flip whichever cell was clicked.

mouseDragged()

mouseDragged() is a built-in p5.js event function that fires repeatedly while the mouse moves with a button held down, enabling drag-to-draw interactions.

function mouseDragged() {
  toggleCellAt(mouseX, mouseY);
}
Line-by-line explanation (1 lines)
toggleCellAt(mouseX, mouseY);
Runs continuously while the mouse button is held and moved, toggling cells the cursor passes over so you can 'paint' patterns by dragging.

mouseReleased()

This function clears the 'last toggled cell' memory once the mouse is released, so a future drag beginning at the same cell will correctly toggle it again.

function mouseReleased() {
  lastCol = -1;
  lastRow = -1;
}
Line-by-line explanation (2 lines)
lastCol = -1;
Resets the tracked last-toggled column so the next click or drag starts fresh.
lastRow = -1;
Resets the tracked last-toggled row for the same reason.

toggleCellAt()

This function shows the common pattern of converting continuous mouse-pixel coordinates into discrete grid indices, plus a 'debounce' guard to avoid re-triggering on the same cell repeatedly.

🔬 What if instead of toggling just one cell, you also set its neighbors to alive? Try setting grid[col][row] = 1 always, plus the cell to the right, and see how dragging paints thicker shapes.

  if (col >= 0 && col < cols && row >= 0 && row < rows) {
    grid[col][row] = grid[col][row] ? 0 : 1;
    lastCol = col;
    lastRow = row;
  }
function toggleCellAt(mx, my) {
  // Ignore if outside the canvas
  if (mx < 0 || mx >= width || my < 0 || my >= height) return;

  const col = floor(mx / cellSize);
  const row = floor(my / cellSize);

  // Avoid toggling the same cell multiple times while dragging
  if (col === lastCol && row === lastRow) return;

  if (col >= 0 && col < cols && row >= 0 && row < rows) {
    grid[col][row] = grid[col][row] ? 0 : 1;
    lastCol = col;
    lastRow = row;
  }
}
Line-by-line explanation (8 lines)

🔧 Subcomponents:

conditional Canvas Bounds Guard if (mx < 0 || mx >= width || my < 0 || my >= height) return;

Exits early if the mouse position is outside the canvas, preventing errors

conditional Repeat Toggle Guard if (col === lastCol && row === lastRow) return;

Prevents the same cell from flickering on and off rapidly while dragging across it

conditional Toggle Cell State grid[col][row] = grid[col][row] ? 0 : 1;

Flips the cell's state between alive and dead using a ternary expression

if (mx < 0 || mx >= width || my < 0 || my >= height) return;
Stops the function immediately if the mouse is outside the visible canvas area.
const col = floor(mx / cellSize);
Converts the mouse's pixel x-position into a grid column index by dividing by the cell size and rounding down.
const row = floor(my / cellSize);
Does the same conversion for the row index using the y-position.
if (col === lastCol && row === lastRow) return;
If this is the same cell that was just toggled, do nothing - this stops rapid re-toggling while dragging slowly.
if (col >= 0 && col < cols && row >= 0 && row < rows) {
Double-checks the calculated column/row are inside the grid bounds before touching the array.
grid[col][row] = grid[col][row] ? 0 : 1;
Flips the cell: if it's currently truthy (1, alive) it becomes 0 (dead), otherwise it becomes 1 (alive).
lastCol = col;
Remembers this column so the guard above can detect if the next event targets the same cell.
lastRow = row;
Remembers this row for the same purpose.

keyPressed()

keyPressed() is a built-in p5.js event function that fires once each time any key is pressed, and the global 'key' variable holds the character that was typed.

function keyPressed() {
  if (key === " ") {
    running = !running;
    // Return false to prevent the page from scrolling on spacebar
    return false;
  }
}
Line-by-line explanation (3 lines)

🔧 Subcomponents:

conditional Spacebar Check if (key === " ") {

Detects specifically the spacebar key to toggle the simulation on or off

if (key === " ") {
Checks if the key that was just pressed is the spacebar.
running = !running;
Flips the running boolean - true becomes false and vice versa - starting or pausing the simulation.
return false;
Prevents the browser's default spacebar behavior (scrolling the page down) from happening.

windowResized()

windowResized() is a built-in p5.js event function that fires automatically whenever the browser window changes size, letting the sketch stay responsive.

function windowResized() {
  resizeCanvas(windowWidth, windowHeight);
  initGrid(); // Recreate an empty grid on resize
}
Line-by-line explanation (2 lines)
resizeCanvas(windowWidth, windowHeight);
Resizes the p5.js canvas to match the browser window's new dimensions.
initGrid(); // Recreate an empty grid on resize
Rebuilds the grid arrays from scratch to fit the new canvas size, which unfortunately clears any pattern the user had drawn.

📦 Key Variables

cellSize number

The pixel width/height of each grid cell, controlling the resolution and visual scale of the simulation.

let cellSize = 14;
cols number

How many columns of cells fit across the canvas, calculated from width and cellSize.

let cols;
rows number

How many rows of cells fit down the canvas, calculated from height and cellSize.

let rows;
grid array

A 2D array holding the current generation's cell states (0 = dead, 1 = alive).

let grid;
nextGrid array

A second 2D array used to store the computed next generation before it's swapped in to become the current grid.

let nextGrid;
running boolean

Tracks whether the simulation is actively stepping forward each frame or paused, toggled by spacebar.

let running = false;
lastCol number

Remembers the column of the last cell toggled by the mouse, to avoid re-toggling the same cell repeatedly while dragging.

let lastCol = -1;
lastRow number

Remembers the row of the last cell toggled by the mouse, paired with lastCol for the same drag-debounce purpose.

let lastRow = -1;

🔧 Potential Improvements (4)

Here are some ways this code could be enhanced:

FEATURE windowResized()

Resizing the browser window completely wipes out the user's drawn pattern because initGrid() rebuilds fresh empty arrays.

💡 Copy the old grid's alive cells into the new, differently-sized grid (clamping indices to the new bounds) instead of discarding them entirely.

PERFORMANCE drawGridLines()

On a large window, this draws one line() call per row and column every single frame, which can be hundreds of draw calls even when the grid isn't changing.

💡 Draw the grid lines once onto an offscreen graphics buffer (createGraphics) at startup/resize, then just image() that buffer each frame instead of redrawing every line.

FEATURE keyPressed()

There's no way to clear the grid or randomize it without refreshing the page or manually clicking every cell.

💡 Add extra key checks, e.g. 'c' to clear the grid to all zeros and 'r' to randomly fill it, giving users faster ways to experiment with patterns.

STYLE stepGameOfLife()

The neighbor-counting inner double loop runs 8 checks (with a continue) for every one of potentially thousands of cells each frame, which is somewhat repetitive to read.

💡 Consider extracting a countNeighbors(x, y) helper function to make stepGameOfLife() more readable, separating 'counting' logic from 'rule application' logic.

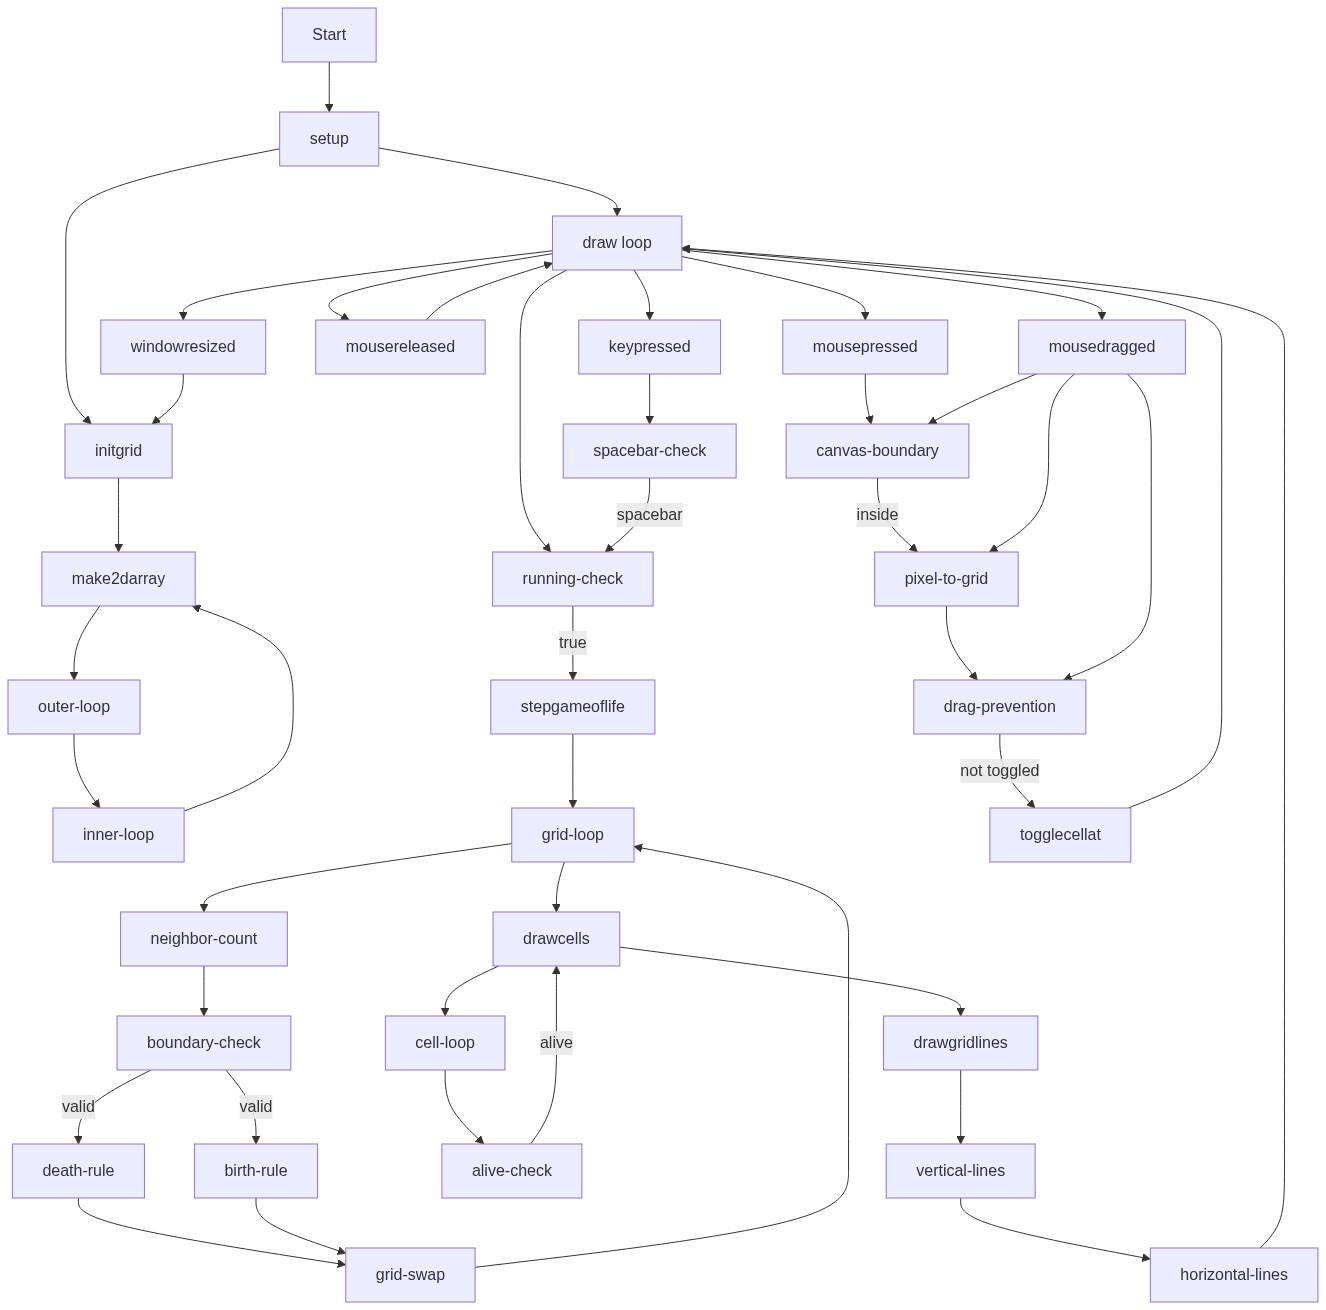
🔄 Code Flow

Code flow showing setup, initgrid, make2darray, draw, stepgameoflife, drawcells, drawgridlines, mousepressed, mousedragged, mousereleased, togglecellat, keypressed, windowresized

💡 Click on function names in the diagram to jump to their code

graph TD start[Start] --> setup[setup] setup --> initgrid[initgrid] initgrid --> make2darray[make2darray] make2darray --> outer-col-loop[outer-col-loop] outer-col-loop --> inner-row-loop[inner-row-loop] inner-row-loop --> initgrid setup --> draw[draw loop] draw --> running-check[running-check] running-check -->|true| stepgameoflife[stepgameoflife] stepgameoflife --> cell-loop[cell-loop] cell-loop --> neighbor-loop[neighbor-loop] neighbor-loop --> self-skip[self-skip] self-skip --> bounds-check[bounds-check] bounds-check -->|true| conway-rules[conway-rules] conway-rules --> swap-grids[swap-grids] swap-grids --> stepgameoflife draw --> draw-loop[draw-loop] draw-loop --> alive-check[alive-check] alive-check -->|true| drawcells[drawcells] drawcells --> draw-loop draw-loop --> drawgridlines[drawgridlines] drawgridlines --> vertical-lines[vertical-lines] vertical-lines --> horizontal-lines[horizontal-lines] horizontal-lines --> draw click setup href "#fn-setup" click initgrid href "#fn-initgrid" click make2darray href "#fn-make2darray" click draw href "#fn-draw" click stepgameoflife href "#fn-stepgameoflife" click drawcells href "#fn-drawcells" click drawgridlines href "#fn-drawgridlines" click outer-col-loop href "#sub-outer-col-loop" click inner-row-loop href "#sub-inner-row-loop" click running-check href "#sub-running-check" click cell-loop href "#sub-cell-loop" click neighbor-loop href "#sub-neighbor-loop" click self-skip href "#sub-self-skip" click bounds-check href "#sub-bounds-check" click conway-rules href "#sub-conway-rules" click swap-grids href "#sub-swap-grids" click draw-loop href "#sub-draw-loop" click alive-check href "#sub-alive-check" click vertical-lines href "#sub-vertical-lines" click horizontal-lines href "#sub-horizontal-lines"

❓ Frequently Asked Questions

What visual effects can I expect from the AI Cellular Automaton Lab sketch?

The sketch creates a dynamic simulation of Conway's Game of Life, featuring neon green cells on a dark background that evolve based on specific rules.

How can I interact with the Conway's Game of Life simulation?

Users can click or drag to toggle cells on the grid, and press the spacebar to play or pause the simulation.

What creative coding concepts does this p5.js sketch illustrate?

This sketch demonstrates cellular automata and grid-based programming, showcasing how simple rules can lead to complex, emergent behaviors.

Preview

AI Cellular Automaton Lab - Conway's Game of Life Classic cellular automaton simulation! Click or d - p5.js creative coding sketch preview
Sketch Preview
Code flow diagram showing the structure of AI Cellular Automaton Lab - Conway's Game of Life Classic cellular automaton simulation! Click or d - Code flow showing setup, initgrid, make2darray, draw, stepgameoflife, drawcells, drawgridlines, mousepressed, mousedragged, mousereleased, togglecellat, keypressed, windowresized
Code Flow Diagram