AI Day Pie Clock - Time as a Shrinking Pie

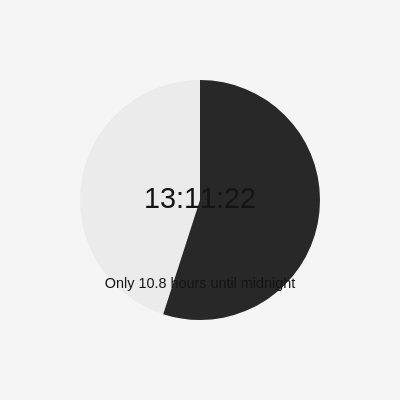
This sketch turns the current time of day into a giant pie chart: a dark wedge grows clockwise from midnight to show how much of the day has already passed, while the lighter remaining slice shrinks. The exact time and hours left until midnight are printed in the center, and the remaining slice changes color to orange and then red as the evening gets late.

🧪 Try This!

Experiment with the code by making these changes:

  1. Make the pie fill more of the screen — Increasing the diameter multiplier makes the whole pie chart bigger relative to the window.
  2. Trigger the urgency colors earlier — Lowering the hour thresholds makes the pie turn orange and red much earlier in the day, so you can preview the effect without waiting until evening.
  3. Recolor the elapsed wedge — Changing the fill color before the second arc() call changes what the 'already gone' portion of the day looks like.
Prefer the full editor? Open it there →

📖 About This Sketch

This sketch reimagines a normal digital clock as a full-day pie chart: a dark wedge sweeps clockwise from the top of a circle, growing throughout the day to show elapsed time, while the remaining light wedge shrinks toward nothing at midnight. The current time and a countdown of 'hours until midnight' are printed directly in the center of the pie. As the hour gets later, the remaining slice shifts from neutral gray to orange (after 6pm) and finally to red (after 9pm), giving the whole visualization a built-in sense of urgency. It's built almost entirely from p5's arc() function in PIE mode, plus the real-time clock helpers hour(), minute(), and second().

The whole sketch lives inside a single draw() function that recalculates everything from scratch every frame - there's no state stored between frames, no classes, and no arrays. By studying it you'll learn how to convert real-world time into an angle and a fraction, how PIE-mode arcs let you fake a pie chart with just two arc() calls, and how simple conditional logic can drive color changes based on data (in this case, the hour of day).

⚙️ How It Works

  1. When the page loads, setup() creates a canvas that fills the entire browser window and sets text alignment to CENTER so any text drawn later is centered on its x/y coordinates.
  2. Every frame, draw() clears the background and asks p5 for the current hour, minute, and second using the built-in hour(), minute(), and second() functions.
  3. It converts that time into total seconds since midnight, divides by 86400 (the number of seconds in a day) to get a fraction from 0 to 1, and multiplies that fraction by TWO_PI to get an angle in radians.
  4. Based on the hour, it decides the color of the 'remaining' slice: light gray normally, orange from 6pm onward, and red from 9pm onward for a sense of urgency.
  5. It draws a full circle in the remaining color first, then draws a dark PIE-mode arc on top that sweeps from the top of the circle around to the computed angle, visually representing the elapsed portion of the day.
  6. Finally it prints the live HH:MM:SS clock and a 'hours until midnight' countdown as centered text over the pie, and windowResized() keeps the canvas matching the browser window if it's resized.

🎓 Concepts You'll Learn

Drawing pie charts with arc() in PIE modeReading real-time clock values with hour(), minute(), second()Mapping time into fractions and angles (TWO_PI, HALF_PI)Conditional color changes based on dataCentered text rendering with textAlign() and text()Responsive canvas sizing with windowResized()

📝 Code Breakdown

setup()

setup() runs once when the sketch starts. Here it's used to make the canvas responsive to the browser window and to configure text alignment that will be reused every frame in draw().

function setup() {
  createCanvas(windowWidth, windowHeight);
  textAlign(CENTER, CENTER);
}
Line-by-line explanation (2 lines)
createCanvas(windowWidth, windowHeight);
Creates a canvas that fills the entire browser window, using p5's built-in windowWidth and windowHeight variables.
textAlign(CENTER, CENTER);
Sets text alignment so that any text() call centers its text both horizontally and vertically on the given x/y coordinate - essential for centering the clock in the pie.

draw()

draw() runs continuously, about 60 times per second, and since this sketch has no stored state between frames, it recalculates the entire pie and text from the live system clock every single time. This is a great example of a sketch driven purely by real-world data (the current time) rather than by internal physics or user input.

🔬 These two lines decide when the pie turns orange and then red. What happens if you lower the 18 and 21 thresholds to, say, 6 and 9 (as in 6am and 9am)? What if you swap the colors so it starts red and becomes calmer later?

  if (h >= 21) remainingCol = color(255, 80, 80);
  else if (h >= 18) remainingCol = color(255, 160, 60);

🔬 The first arc draws a full circle, and the second arc draws only up to the elapsed angle on top of it. What happens if you swap which arc uses 'ang' and which uses 'TWO_PI' - does the meaning of dark vs light flip?

  fill(remainingCol); arc(cx, cy, d, d, start, start + TWO_PI, PIE);
  fill(40); arc(cx, cy, d, d, start, start + ang, PIE);
function draw() {
  background(245);
  let h = hour(), m = minute(), s = second();
  let total = h * 3600 + m * 60 + s;
  let frac = total / 86400;
  let start = -HALF_PI, ang = frac * TWO_PI;
  let d = min(width, height) * 0.6;
  let cx = width / 2, cy = height / 2;
  let remainingCol = color(235);
  if (h >= 21) remainingCol = color(255, 80, 80);
  else if (h >= 18) remainingCol = color(255, 160, 60);
  noStroke();
  fill(remainingCol); arc(cx, cy, d, d, start, start + TWO_PI, PIE);
  fill(40); arc(cx, cy, d, d, start, start + ang, PIE);
  fill(20);
  textSize(d * 0.12);
  let hh = nf(h, 2), mm = nf(m, 2), ss = nf(s, 2);
  text(hh + ":" + mm + ":" + ss, cx, cy);
  textSize(d * 0.06);
  let hrsLeft = 24 - (h + m / 60 + s / 3600);
  hrsLeft = max(0, hrsLeft);
  text("Only " + hrsLeft.toFixed(1) + " hours until midnight", cx, cy + d * 0.35);
}

Line-by-line explanation (19 lines)

🔧 Subcomponents:

conditional Urgency Color Threshold if (h >= 21) remainingCol = color(255, 80, 80); else if (h >= 18) remainingCol = color(255, 160, 60);

Changes the remaining-time slice's color to orange after 6pm and red after 9pm to signal urgency as the day winds down.

calculation Draw Full Base Pie fill(remainingCol); arc(cx, cy, d, d, start, start + TWO_PI, PIE);

Draws a complete circle in the remaining-time color as the base layer, representing the whole 24-hour day before the elapsed portion is drawn on top.

calculation Draw Elapsed Dark Wedge fill(40); arc(cx, cy, d, d, start, start + ang, PIE);

Draws a dark PIE-mode wedge from the top of the circle sweeping clockwise to the current time's angle, visually representing elapsed time.

background(245);
Clears the canvas each frame with a near-white color so nothing from the previous frame lingers.
let h = hour(), m = minute(), s = second();
Grabs the current hour (0-23), minute (0-59), and second (0-59) from the system clock using p5's built-in time functions.
let total = h * 3600 + m * 60 + s;
Converts the current time into a single number: total seconds elapsed since midnight.
let frac = total / 86400;
Divides by 86400 (the number of seconds in a full day) to get a fraction between 0 and 1 representing how far through the day we are.
let start = -HALF_PI, ang = frac * TWO_PI;
start is set to -HALF_PI so the pie begins at the top (12 o'clock position) instead of the default right side; ang converts the day-fraction into radians for the arc's sweep angle.
let d = min(width, height) * 0.6;
Sets the pie's diameter to 60% of whichever canvas dimension is smaller, so the pie always fits nicely regardless of window shape.
let cx = width / 2, cy = height / 2;
Calculates the center point of the canvas where the pie will be drawn.
let remainingCol = color(235);
Sets a default light-gray color for the remaining-time slice before checking if it's evening.
if (h >= 21) remainingCol = color(255, 80, 80);
If it's 9pm or later, overrides the remaining color to a red for urgency.
else if (h >= 18) remainingCol = color(255, 160, 60);
Otherwise, if it's 6pm or later, sets the remaining color to orange as an earlier warning.
fill(remainingCol); arc(cx, cy, d, d, start, start + TWO_PI, PIE);
Fills with the remaining color and draws a full circle (a full TWO_PI sweep) as the base of the pie chart.
fill(40); arc(cx, cy, d, d, start, start + ang, PIE);
Fills with a dark gray and draws a PIE-mode wedge from the top around to the current time's angle, covering the elapsed portion of the day.
textSize(d * 0.12);
Sets the font size for the big clock text proportionally to the pie's diameter, so it scales with window size.
let hh = nf(h, 2), mm = nf(m, 2), ss = nf(s, 2);
Uses p5's nf() (number format) function to pad hour, minute, and second to always show two digits, e.g. '05' instead of '5'.
text(hh + ":" + mm + ":" + ss, cx, cy);
Draws the formatted HH:MM:SS clock text centered in the middle of the pie.
textSize(d * 0.06);
Shrinks the text size for the smaller countdown message below the main clock.
let hrsLeft = 24 - (h + m / 60 + s / 3600);
Calculates how many hours remain until midnight by converting the current time into a decimal number of hours and subtracting from 24.
hrsLeft = max(0, hrsLeft);
Clamps the value so it never goes negative (protects against tiny floating point rounding issues right at midnight).
text("Only " + hrsLeft.toFixed(1) + " hours until midnight", cx, cy + d * 0.35);
Draws the countdown message below the clock, formatting the hours remaining to one decimal place.

windowResized()

windowResized() is a special p5.js function that p5 calls automatically whenever the browser window is resized. Pairing it with windowWidth/windowHeight in createCanvas() is the standard pattern for building fullscreen, responsive sketches.

function windowResized() {
  resizeCanvas(windowWidth, windowHeight);
}
Line-by-line explanation (1 lines)
resizeCanvas(windowWidth, windowHeight);
Automatically called by p5 whenever the browser window changes size; resizes the canvas to match the new window dimensions so the pie stays centered and properly sized.

📦 Key Variables

h, m, s number

Store the current hour, minute, and second of the day, read fresh every frame from p5's hour(), minute(), second() functions - these drive every other calculation in draw().

let h = hour(), m = minute(), s = second();
total / frac number

total converts the current time into seconds since midnight; frac turns that into a 0-1 fraction of the day elapsed, which is used to compute the pie's sweep angle.

let total = h * 3600 + m * 60 + s;
let frac = total / 86400;
start / ang number

start is the fixed starting angle (top of the circle); ang is the elapsed-time angle in radians used to draw the dark wedge.

let start = -HALF_PI, ang = frac * TWO_PI;
d number

The diameter of the pie chart, calculated as a percentage of the smaller canvas dimension so the pie scales responsively with window size.

let d = min(width, height) * 0.6;
cx, cy number

The x and y coordinates of the canvas center, used as the pivot point for every arc() and text() call.

let cx = width / 2, cy = height / 2;
remainingCol object

A p5.Color object representing the color of the 'time remaining' slice; it changes based on the hour to signal urgency later in the day.

let remainingCol = color(235);
hrsLeft number

The number of hours remaining until midnight, computed as a decimal and displayed in the countdown text below the clock.

let hrsLeft = 24 - (h + m / 60 + s / 3600);

🔧 Potential Improvements (4)

Here are some ways this code could be enhanced:

PERFORMANCE draw()

New p5.Color objects are created every single frame via color(235), color(255, 80, 80), and color(255, 160, 60), even though only one of these colors is ever needed per frame and the underlying values never change.

💡 Precompute these three color objects once in setup() and store them in variables (e.g. defaultCol, orangeCol, redCol), then just reference them inside draw() instead of recreating them 60 times a second.

STYLE draw()

Several lines declare multiple variables with comma syntax on one line (e.g. 'let h = hour(), m = minute(), s = second();' and 'let start = -HALF_PI, ang = frac * TWO_PI;'), which can be harder for beginners to read and debug.

💡 Split these into separate 'let' statements, one variable per line, to make the code easier to scan and to make it obvious each variable has its own purpose.

BUG draw() hrsLeft calculation

hrsLeft is calculated independently from frac/ang using its own formula (24 - decimal hours), duplicating logic that already exists in the frac calculation used for the pie. If someone changes how frac is computed, hrsLeft could get out of sync with the visual pie.

💡 Derive hrsLeft directly from frac, e.g. 'let hrsLeft = max(0, 24 * (1 - frac));', so there's a single source of truth for how much of the day is left.

FEATURE draw()

The sketch always assumes a 24-hour day ending at local midnight, with no way for a viewer to customize the 'end of day' time (e.g. bedtime) or use a 12-hour clock display.

💡 Add a configurable 'dayEndHour' variable and let users click or press a key to cycle through different countdown targets (like 'hours until bedtime' vs 'hours until midnight'), making the sketch more personally useful.

🔄 Code Flow

Code flow showing setup, draw, windowresized

💡 Click on function names in the diagram to jump to their code

graph TD start[Start] --> setup[setup] setup --> draw[draw loop] draw --> urgencycolor[urgency-color-conditional] draw --> fullpie[full-pie-draw] draw --> elapsedpie[elapsed-pie-draw] urgencycolor --> draw fullpie --> draw elapsedpie --> draw click setup href "#fn-setup" click draw href "#fn-draw" click urgencycolor href "#sub-urgency-color-conditional" click fullpie href "#sub-full-pie-draw" click elapsedpie href "#sub-elapsed-pie-draw"

❓ Frequently Asked Questions

What visual representation does the AI Day Pie Clock sketch create?

The sketch visually represents the passage of time as a pie chart, illustrating how much of the day has elapsed versus how much remains, with color changes indicating urgency as the day progresses.

Is there any interaction available for users in the AI Day Pie Clock sketch?

The sketch does not offer interactive features; it simply displays the current time and the visual representation of the day as a pie chart.

What creative coding concepts are demonstrated in the AI Day Pie Clock sketch?

This sketch demonstrates the use of p5.js for real-time data visualization, utilizing arcs to create a pie chart and color coding to convey urgency in relation to time.

Preview

AI Day Pie Clock - Time as a Shrinking Pie - p5.js creative coding sketch preview
Sketch Preview
Code flow diagram showing the structure of AI Day Pie Clock - Time as a Shrinking Pie - Code flow showing setup, draw, windowresized
Code Flow Diagram