centerX
number
The real (horizontal) part of the complex number at the center of the current view.
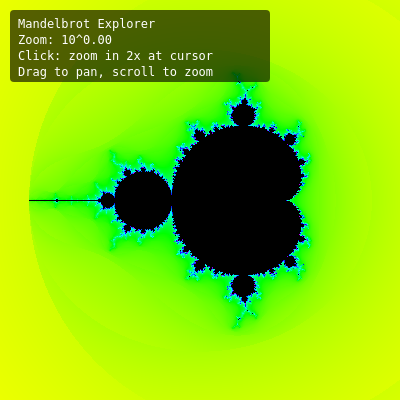
let centerX = -0.5;
centerY
number
The imaginary (vertical) part of the complex number at the center of the current view.
let centerY = 0.0;
BASE_VIEW_WIDTH
number
The width of the complex plane visible at zoom level 1x; used as the reference point for calculating current zoom depth.
const BASE_VIEW_WIDTH = 3.5;
viewWidth
number
How wide the visible slice of the complex plane currently is - shrinking it zooms in, growing it zooms out.
let viewWidth = BASE_VIEW_WIDTH;
fractalImg
object
A p5.Image buffer that stores the final colored fractal picture, redrawn to the canvas every frame with image().
let fractalImg;
iterData
array
A Float32Array caching the normalized escape-time value (or -1 for interior) for every pixel, so color animation doesn't require redoing the Mandelbrot math.
let iterData;
viewDirty
boolean
Flags whether the view has changed since the last fractal computation, so draw() knows whether to recompute the expensive math.
let viewDirty = true;
isDragging
boolean
Tracks whether the mouse button is currently held down after being pressed inside the canvas.
let isDragging = false;
dragStartX
number
The mouse's x position at the moment a drag began, used to measure how far the mouse has moved.
let dragStartX = 0;
dragStartY
number
The mouse's y position at the moment a drag began.
let dragStartY = 0;
dragStartCenterX
number
The view's centerX value at the moment a drag began, used as the base for panning calculations.
let dragStartCenterX = 0;
dragStartCenterY
number
The view's centerY value at the moment a drag began.
let dragStartCenterY = 0;
hasDragged
boolean
Becomes true once the mouse moves far enough during a press, distinguishing a drag/pan from a simple click/zoom.
let hasDragged = false;
paletteOffset
number
A continuously increasing value (wrapped 0-1) that shifts the color palette's hue every frame to create the animated swirl effect.
let paletteOffset = 0;
PALETTE_SPEED
number
How much paletteOffset increases per frame, controlling how fast the colors cycle.
const PALETTE_SPEED = 0.003;