
AI Growing Plant - Seed to Flower Journey

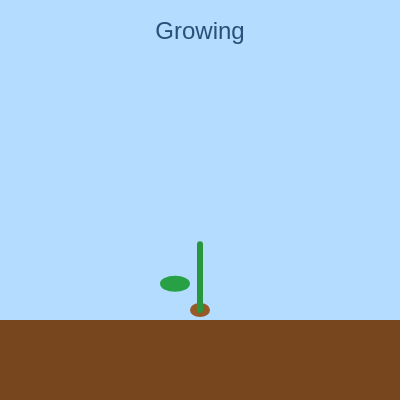
This sketch animates a plant's entire life cycle in a single continuous ten-second sequence: a brown seed sits in soil, sprouts a green stem, grows two leaves, and finally opens into a six-petaled flower with a glowing yellow center. A text label at the top tracks the current stage (Seed, Sprouting, Growing, Blooming, Full Bloom!) so the viewer always knows where the plant is in its journey.

🧪 Try This!

Experiment with the code by making these changes:

  1. Speed up the whole life cycle — Lowering the divisor makes the plant reach 'Full Bloom!' in just 3 seconds instead of 10.
  2. Recolor the petals — The fill() call right before the petal loop sets the color used for every petal drawn that frame.
  3. Grow ten petals instead of six — Updating both the loop count and the angle divisor together keeps the petals evenly spaced around the flower.
Prefer the full editor? Open it there →

📖 About This Sketch

This sketch tells a tiny visual story: over ten seconds, a seed buried in soil grows a stem, sprouts leaves, and blossoms into a pink flower with a yellow center, while a text label announces each stage of growth. It's a great sketch to study because it shows how a single time-based variable can drive an entire animated sequence using nothing but millis(), constrain(), and a handful of if-statements - no classes, arrays, or physics required.

All of the logic lives inside one draw() function that runs every frame. A progress value from 0 to 1 is calculated from elapsed time, and that single number is used everywhere: to stretch the stem's height, to decide when leaves and petals should appear, and to pick which stage label to display. Studying this code teaches you how to build staged, timed animations and how trigonometry (cos/sin) can arrange shapes evenly in a circle for the flower's petals.

⚙️ How It Works

  1. When the page loads, setup() creates a full-window canvas, records the exact starting time in the startTime variable, and configures text alignment and size for the stage label.
  2. Every frame, draw() first repaints the sky-blue background and the brown soil strip at the bottom, wiping away the previous frame so the animation looks smooth.
  3. A progress value t is calculated by comparing the current time to startTime, dividing by 10000 (ten seconds), and clamping the result between 0 and 1 with constrain() - this single number controls the whole animation.
  4. The stem's height is set to stemMax multiplied by t, so it grows taller as t increases, and a series of if-statements reveal the stem, leaves, and flower only after t crosses specific thresholds (0.1, 0.3, 0.4, 0.6).
  5. Once t passes 0.6, a for-loop draws six petals in a circle around the top of the stem using cos() and sin() to place each one at an even angle, followed by a small yellow center circle.
  6. A chain of if-statements checks t against thresholds (0.1, 0.3, 0.6, 0.9) to decide which stage label - Seed, Sprouting, Growing, Blooming, or Full Bloom! - gets drawn at the top of the screen.

🎓 Concepts You'll Learn

Time-based animation with millis()Normalizing progress with constrain()Staged reveal using threshold conditionalsTrigonometry for radial layouts (cos/sin)Responsive canvas with windowResized()State-driven text labels

📝 Code Breakdown

setup()

setup() runs exactly once, right when the sketch starts. It's the perfect place to record a starting timestamp (like startTime) that later code can compare against millis() to measure elapsed time.

function setup() {
  createCanvas(windowWidth, windowHeight);
  startTime = millis();
  textAlign(CENTER, TOP);
  textSize(24);
}
Line-by-line explanation (4 lines)
createCanvas(windowWidth, windowHeight);
Creates a canvas that fills the entire browser window, so the plant scene stretches to whatever screen size the viewer has.
startTime = millis();
Records the exact moment (in milliseconds since the page loaded) that the sketch started - this is the reference point used later to measure how much time has passed.
textAlign(CENTER, TOP);
Configures future text() calls to be centered horizontally and aligned from the top, so the stage label sits neatly at the top-center of the screen.
textSize(24);
Sets the font size used for the stage label text drawn every frame.
draw()

draw() runs continuously, about 60 times per second, redrawing the entire scene from scratch each time. By deriving everything (stem height, which leaves are visible, whether the flower is blooming, and the label text) from a single progress value t, the sketch shows how one time-based number can drive a whole staged animation without needing separate timers for each part.

🔬 This loop draws 6 evenly-spaced petals using TWO_PI * i / 6 to calculate each petal's angle. What happens if you change the loop condition to i < 12 but leave the angle formula dividing by 6? What do you need to change to correctly get 12 evenly-spaced petals?

    for (let i = 0; i < 6; i++) {
      let a = TWO_PI * i / 6;
      ellipse(fx + 20 * cos(a), fy + 20 * sin(a), 20, 28);
    }

🔬 Each line can overwrite the stage set by the line before it. What happens if you change the Full Bloom threshold from 0.9 to 0.5 - will 'Blooming' ever show up on screen?

  let stage = "Seed";
  if (t > 0.1) stage = "Sprouting";
  if (t > 0.3) stage = "Growing";
  if (t > 0.6) stage = "Blooming";
  if (t > 0.9) stage = "Full Bloom!";
function draw() {
  background(180, 220, 255);
  let soilH = 80;
  noStroke();
  fill(120, 70, 30);
  rect(0, height - soilH, width, soilH);
  let t = constrain((millis() - startTime) / 10000, 0, 1);
  let baseX = width / 2, baseY = height - soilH;
  fill(150, 90, 40);
  ellipse(baseX, baseY - 10, 20, 14);
  let stemMax = height - soilH - 120;
  let stemH = stemMax * t;
  if (t > 0.1) {
    stroke(40, 150, 60);
    strokeWeight(6);
    line(baseX, baseY - 10, baseX, baseY - 10 - stemH);
    noStroke();
    fill(40, 160, 70);
    if (t > 0.3) ellipse(baseX - 25, baseY - 10 - stemH * 0.4, 30, 16);
    if (t > 0.4) ellipse(baseX + 25, baseY - 10 - stemH * 0.6, 30, 16);
  }
  if (t > 0.6) {
    let fx = baseX, fy = baseY - 10 - stemH;
    fill(255, 80, 140);
    for (let i = 0; i < 6; i++) {
      let a = TWO_PI * i / 6;
      ellipse(fx + 20 * cos(a), fy + 20 * sin(a), 20, 28);
    }
    fill(255, 230, 140);
    ellipse(fx, fy, 18, 18);
  }
  let stage = "Seed";
  if (t > 0.1) stage = "Sprouting";
  if (t > 0.3) stage = "Growing";
  if (t > 0.6) stage = "Blooming";
  if (t > 0.9) stage = "Full Bloom!";
  fill(40, 80, 120);
  text(stage, width / 2, 20);
}
Line-by-line explanation (21 lines)

🔧 Subcomponents:

conditional Sprouting Stage Block if (t > 0.1) { ... }

Only draws the stem (and later, leaves) once the growth progress passes 10%, hiding it completely before that.

conditional First Leaf if (t > 0.3) ellipse(baseX - 25, baseY - 10 - stemH * 0.4, 30, 16);

Reveals the left leaf once progress passes 30%, positioned partway up the stem.

conditional Second Leaf if (t > 0.4) ellipse(baseX + 25, baseY - 10 - stemH * 0.6, 30, 16);

Reveals the right leaf a bit later, once progress passes 40%, higher up the stem.

conditional Flower Bloom Block if (t > 0.6) { ... }

Draws the flower's petals and center only after progress passes 60%, representing the blooming stage.

for-loop Petal Drawing Loop for (let i = 0; i < 6; i++) { ... }

Loops six times to draw six petals arranged evenly around the flower's center using trigonometry.

conditional Stage Label Chain if (t > 0.1) stage = "Sprouting"; ... if (t > 0.9) stage = "Full Bloom!";

A sequence of if-statements that overwrites the stage text as progress crosses each threshold, ending with the final label that applies.

background(180, 220, 255);
Repaints the whole canvas sky-blue every frame, erasing the previous frame's drawing so the animation looks smooth instead of leaving trails.
let soilH = 80;
Sets the height in pixels of the brown soil strip along the bottom of the canvas.
rect(0, height - soilH, width, soilH);
Draws the soil as a rectangle spanning the full canvas width, positioned flush against the bottom edge.
let t = constrain((millis() - startTime) / 10000, 0, 1);
Calculates how far through the 10-second growth cycle we are: millis() - startTime gives elapsed milliseconds, dividing by 10000 turns that into a 0-to-1 fraction, and constrain() locks the value at 1 once the cycle finishes so the plant doesn't overgrow.
let baseX = width / 2, baseY = height - soilH;
Defines the point where the seed sits and the stem begins: horizontally centered on screen, right at the top of the soil.
ellipse(baseX, baseY - 10, 20, 14);
Draws the brown seed as a small oval slightly above the soil surface.
let stemMax = height - soilH - 120;
Calculates the tallest the stem is allowed to grow, leaving 120 pixels of empty space at the top of the screen for the flower to bloom into.
let stemH = stemMax * t;
Scales the stem's current height by the progress fraction t, so it grows from 0 up to stemMax as time passes.
if (t > 0.1) {
This whole block of stem and leaf drawing only runs once progress exceeds 10%, which is what makes the sprout 'appear' partway through the animation.
line(baseX, baseY - 10, baseX, baseY - 10 - stemH);
Draws the green stem as a vertical line reaching from the seed up to the current stem height.
if (t > 0.3) ellipse(baseX - 25, baseY - 10 - stemH * 0.4, 30, 16);
Draws the left leaf once growth passes 30%, positioned 40% of the way up the current stem height.
if (t > 0.4) ellipse(baseX + 25, baseY - 10 - stemH * 0.6, 30, 16);
Draws the right leaf a bit later (once past 40%), positioned higher up the stem than the first leaf.
if (t > 0.6) {
The flower only starts being drawn once growth passes 60%, marking the 'Blooming' stage.
let fx = baseX, fy = baseY - 10 - stemH;
Sets the flower's center point to sit right at the very top of the current stem.
for (let i = 0; i < 6; i++) {
Loops six times, once for each petal, so the same drawing code can place multiple petals without repeating it manually.
let a = TWO_PI * i / 6;
Calculates an angle (in radians) for each petal so all six are spread evenly around a full circle (TWO_PI radians = 360 degrees).
ellipse(fx + 20 * cos(a), fy + 20 * sin(a), 20, 28);
Uses cos(a) and sin(a) to convert the angle into an x/y offset 20 pixels from the center, positioning each petal around the flower like spokes on a wheel.
ellipse(fx, fy, 18, 18);
Draws a small yellow circle exactly at the flower's center, like the flower's core.
let stage = "Seed";
Starts the label text as 'Seed' by default before checking any thresholds.
if (t > 0.1) stage = "Sprouting";
Overwrites the stage text once growth passes 10% - later if-statements can overwrite this again as progress increases further.
text(stage, width / 2, 20);
Draws the current stage label centered near the top of the canvas, 20 pixels down from the top edge.

windowResized()

windowResized() is a special p5.js function that's automatically called whenever the browser window is resized. Pairing it with resizeCanvas() keeps full-window sketches responsive on any screen size.

function windowResized() {
  resizeCanvas(windowWidth, windowHeight);
}
Line-by-line explanation (1 lines)
resizeCanvas(windowWidth, windowHeight);
Whenever the browser window changes size, this resizes the canvas to match the new width and height, keeping the sketch full-screen.

📦 Key Variables

startTime number

Stores the timestamp (in milliseconds) from millis() at the moment the sketch started, used as the reference point to calculate elapsed growth time every frame.

let startTime;

🔧 Potential Improvements (4)

Here are some ways this code could be enhanced:

BUG draw() petal loop

The petal count (6 in the for-loop condition) and the angle divisor (also 6 in 'TWO_PI * i / 6') are hardcoded separately. Changing one without the other makes petals overlap unevenly instead of spreading around the full circle.

💡 Store the petal count in a single variable, e.g. 'let numPetals = 6;', and use it in both places: 'for (let i = 0; i < numPetals; i++)' and 'let a = TWO_PI * i / numPetals;'.

FEATURE draw()

Once t reaches 1 (after 10 seconds), the plant stays frozen in 'Full Bloom!' forever with no way to watch it grow again without reloading the page.

💡 Add a mousePressed() function that resets 'startTime = millis();' so clicking anywhere restarts the growth animation.

STYLE draw()

The growth timeline relies on many magic numbers scattered through the function (0.1, 0.3, 0.4, 0.6, 0.9, 120, 10000, 80), making it hard to see or adjust the overall pacing at a glance.

💡 Pull these into named constants near the top, like 'const SPROUT_T = 0.1;' and 'const BLOOM_T = 0.6;', then reference those names in the conditionals for easier tuning and readability.

BUG draw() soil ellipse

The seed ellipse is drawn every frame regardless of growth stage, even after the flower is in full bloom, so it stays visibly stacked underneath the stem the whole time.

💡 Consider fading out or hiding the seed ellipse once t passes a certain threshold (like 0.2), since a real seed would be 'used up' once the plant has sprouted.

🔄 Code Flow

Code flow showing setup, draw, windowresized

💡 Click on function names in the diagram to jump to their code

graph TD start[Start] --> setup[setup] setup --> draw[draw loop] draw --> stemblock[Stem Block] draw --> leaf1[First Leaf] draw --> leaf2[Second Leaf] draw --> flowerblock[Flower Bloom Block] draw --> stagechain[Stage Label Chain] flowerblock --> petalloop[Petal Drawing Loop] click setup href "#fn-setup" click draw href "#fn-draw" click stemblock href "#sub-stem-block" click leaf1 href "#sub-leaf1" click leaf2 href "#sub-leaf2" click flowerblock href "#sub-flower-block" click petalloop href "#sub-petal-loop" click stagechain href "#sub-stage-chain" stemblock -->|if t > 10%| draw leaf1 -->|if t > 30%| draw leaf2 -->|if t > 40%| draw flowerblock -->|if t > 60%| petalloop stagechain -->|if t > thresholds| draw petalloop -->|for i from 0 to 5| flowerblock

❓ Frequently Asked Questions

What visual experience does the AI Growing Plant sketch offer?

The sketch visually narrates the lifecycle of a plant, showcasing the transformation from a seed in soil to a blooming flower through distinct growth stages.

Is there any interactivity in the AI Growing Plant sketch?

This sketch is primarily a visual animation with no interactive elements; it automatically progresses through the plant's lifecycle based on time.

What creative coding concepts does the AI Growing Plant sketch highlight?

The sketch demonstrates key coding techniques such as animation, timing control, and the use of shapes to represent organic growth in a visually appealing way.

Preview

AI Growing Plant - Seed to Flower Journey - p5.js creative coding sketch preview
Sketch Preview
Code flow diagram showing the structure of AI Growing Plant - Seed to Flower Journey - Code flow showing setup, draw, windowresized
Code Flow Diagram