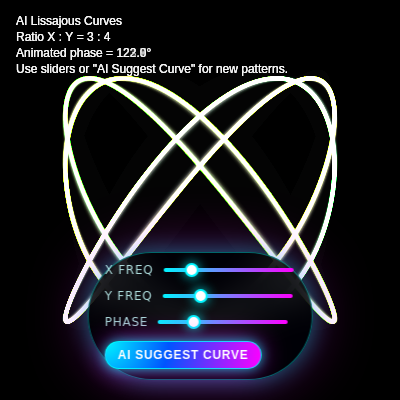
AI Lissajous Curves - Mathematical Harmonic Art Beautiful neon harmonic patterns created by oscilla

This sketch draws glowing, continuously animated Lissajous curves - the classic two-frequency oscillator patterns - using neon additive-blended strokes that leave soft trails. Sliders let you pick the X and Y frequencies and a phase offset, while an 'AI Suggest Curve' button randomly picks aesthetically pleasing frequency ratios and phase values for you.

🧪 Try This!

Experiment with the code by making these changes:

  1. Slow down the whole animation — Lowering the time increment makes the phase wobble, breathing, and curve motion all unfold more slowly and meditatively.
  2. Make trails last much longer — Lowering the trail overlay's alpha means each frame erases less of the previous frame, leaving long glowing streaks behind the curve.
  3. Speed up the rainbow color cycle — Increasing the hueOffset drift rate makes the curve's colors shift through the rainbow much faster.
Prefer the full editor? Open it there →

📖 About This Sketch

This sketch renders a glowing Lissajous curve - the looping figure created when two sine waves at different frequencies drive the x and y position of a point - and animates it forever using time-based phase and radius changes. It layers several p5.js techniques: HSB colorMode() for easy hue cycling, blendMode(ADD) for neon glow, translucent rect() overlays for motion trails, and DOM sliders (createSlider) wired directly into the draw loop. A button labeled 'AI Suggest Curve' randomly picks small-integer frequency ratios from a curated list (or generates coprime integers on the fly) to jump between visually interesting patterns.

The code is organized around a handful of small helper functions - one that builds a labeled slider, one that finds the greatest common divisor of two numbers, and one that uses that GCD check to generate 'interesting' relatively-prime frequency ratios - plus the usual setup()/draw() pair. Studying it teaches you how to combine trigonometric parametric equations with DOM UI controls, how additive blending creates a glow effect, and how a small amount of pseudo-randomness (constrained by math like GCD) can feel like 'AI-generated' variety.

⚙️ How It Works

  1. When the sketch loads, setup() creates a full-window canvas, switches to HSB color mode, builds three labeled sliders (X frequency, Y frequency, phase) and an 'AI Suggest Curve' button, then resets the animation clock.
  2. Every frame, draw() advances a time variable, paints a nearly-transparent black rectangle over the whole canvas (instead of fully clearing it) so old curve strokes fade into trails rather than vanishing instantly.
  3. draw() reads the current slider values for X frequency, Y frequency, and phase, then adds a slow sine-wave wobble to the phase and a gentle 'breathing' pulse to the curve's radius so the shape never sits perfectly still.
  4. A for loop walks along the curve's parametric equations (x = radius * sin(freqX * angle + phase), y = radius * sin(freqY * angle)) hundreds of times per frame, drawing tiny connected line segments whose hue and thickness shift smoothly along the path.
  5. Clicking 'AI Suggest Curve' calls generateInterestingRatio() to pick a pleasing small-integer frequency pair (either from a curated list or a coprime pair found via greatestCommonDivisor), applies it to the sliders along with a random phase, and resets the animation clock so the new curve starts forming cleanly.
  6. A HUD text overlay drawn with normal blending (not additive) shows the current frequency ratio and animated phase so you can see exactly what values are producing the shape on screen.

🎓 Concepts You'll Learn

Parametric equations / Lissajous curvesHSB colorMode and hue cyclingAdditive blend modes for glowDOM UI elements (createSlider, createButton) driving a sketchTrail effects via translucent overlaysGreatest common divisor for generative constraints

📝 Code Breakdown

createLabeledSlider()

This helper wraps p5.js's createDiv/createSpan/createSlider DOM functions to avoid repeating the same five lines three times in setup(). It's a great example of how you can build your own reusable UI-building functions on top of p5.js's DOM API.

function createLabeledSlider(labelText, min, max, initial, step) {
  const group = createDiv();
  group.parent('controls');
  group.addClass('control-group');

  const label = createSpan(labelText);
  label.parent(group);
  label.addClass('control-label');

  const slider = createSlider(min, max, initial, step);
  slider.parent(group);
  slider.addClass('slider');

  return slider;
}
Line-by-line explanation (6 lines)
const group = createDiv();
Creates a new empty <div> element to hold a label and slider together as one visual group.
group.parent('controls');
Attaches the group div inside the HTML element with id 'controls', which is styled as the floating pill-shaped control bar.
group.addClass('control-group');
Adds a CSS class so the group gets the flexbox styling defined in style.css.
const label = createSpan(labelText);
Creates a text label (like 'X freq') using the string passed into this function.
const slider = createSlider(min, max, initial, step);
Creates an HTML range slider with the given minimum, maximum, starting value, and step increment.
return slider;
Returns the slider element so the caller can store it in a variable and later read its .value().
greatestCommonDivisor()

This is a textbook implementation of Euclid's algorithm. It's used here purely as a building block: generateInterestingRatio() calls it to check whether two random integers share no common factors (are 'coprime'), which tends to produce Lissajous curves that don't repeat too simply.

function greatestCommonDivisor(a, b) {
  while (b !== 0) {
    const t = b;
    b = a % b;
    a = t;
  }
  return a;
}
Line-by-line explanation (5 lines)

🔧 Subcomponents:

while-loop Euclidean Algorithm Loop while (b !== 0) {

Repeatedly replaces (a, b) with (b, a % b) until b reaches zero, at which point a holds the greatest common divisor.

while (b !== 0) {
Keeps looping as long as b hasn't reached zero - this is the classic Euclidean algorithm for finding a GCD.
const t = b;
Temporarily saves the current value of b before it gets overwritten.
b = a % b;
The new b becomes the remainder of a divided by b.
a = t;
The new a becomes the old b (saved in t), shifting the pair forward each iteration.
return a;
Once b hits zero, a holds the greatest common divisor of the original two numbers.

generateInterestingRatio()

This function shows how math (the GCD check) can be used to constrain randomness so that 'random' choices still tend to look good - a common trick in generative art often described as 'controlled randomness' or 'curated procedural generation'.

🔬 This loop only searches for frequency values between 1 and 11. What happens if you widen the range to random(1, 30) - do the curves get noticeably more tangled and intricate?

  let a = 1;
  let b = 2;
  for (let i = 0; i < 20; i++) {
    a = int(random(1, 12));
    b = int(random(1, 12));
    if (a !== b && greatestCommonDivisor(a, b) === 1) {
      break;
    }
  }
function generateInterestingRatio() {
  // 70% chance: pick from a curated list of known pretty Lissajous ratios
  if (random() < 0.7) {
    const presets = [
      { x: 1, y: 2 },
      { x: 1, y: 3 },
      { x: 2, y: 3 },
      { x: 2, y: 5 },
      { x: 3, y: 4 },
      { x: 3, y: 5 },
      { x: 3, y: 7 },
      { x: 4, y: 5 },
      { x: 4, y: 7 },
      { x: 5, y: 6 },
      { x: 5, y: 8 },
      { x: 5, y: 9 },
      { x: 6, y: 7 },
      { x: 7, y: 9 },
      { x: 8, y: 9 },
      { x: 8, y: 11 },
      { x: 9, y: 11 }
    ];
    return random(presets);
  }

  // 30% chance: procedurally pick relatively prime small integers
  let a = 1;
  let b = 2;
  for (let i = 0; i < 20; i++) {
    a = int(random(1, 12));
    b = int(random(1, 12));
    if (a !== b && greatestCommonDivisor(a, b) === 1) {
      break;
    }
  }
  return { x: a, y: b };
}
Line-by-line explanation (8 lines)

🔧 Subcomponents:

conditional 70% Curated Preset Branch if (random() < 0.7) {

Most of the time, picks a hand-picked frequency pair known to look good, from the presets array.

for-loop Coprime Search Loop for (let i = 0; i < 20; i++) {

Tries up to 20 times to randomly find two small integers that share no common factor, for a less predictable ratio.

if (random() < 0.7) {
70% of the time (since random() returns 0-1), this branch runs and picks a preset ratio.
return random(presets);
p5's random() can also pick a random ELEMENT from an array - here it grabs one random {x, y} object from the presets list.
let a = 1;
Sets up fallback starting values in case the loop below never finds a good pair (rare edge case).
for (let i = 0; i < 20; i++) {
Tries at most 20 times to find two coprime integers, to avoid an infinite loop.
a = int(random(1, 12));
Picks a random integer between 1 and 11 (int() truncates the decimal from random()).
if (a !== b && greatestCommonDivisor(a, b) === 1) {
Checks that a and b are different AND share no common factors (GCD of 1), meaning the curve won't simplify into a smaller repeating pattern.
break;
Stops the loop early as soon as a good coprime pair is found.
return { x: a, y: b };
Returns the chosen frequency pair as a small object with x and y properties.

resetAnimation()

Small reset functions like this keep related pieces of state (time and color) in sync whenever the sketch needs a fresh start - here that's called both at startup and whenever the AI suggests a new curve.

function resetAnimation() {
  time = 0;
  hueOffset = random(360);
}
Line-by-line explanation (2 lines)
time = 0;
Resets the animation clock back to zero so a newly chosen curve starts drawing from its beginning shape rather than mid-animation.
hueOffset = random(360);
Picks a fresh random starting hue (0-360 in HSB) so each new curve gets a different base color.

applyAISuggestion()

This function is the 'brain' behind the AI Suggest Curve button - it's called directly by suggestButton.mousePressed(applyAISuggestion) in setup(), connecting a DOM button click to changes in the sketch's slider values and internal state.

function applyAISuggestion() {
  const ratio = generateInterestingRatio();
  freqXSlider.value(ratio.x);
  freqYSlider.value(ratio.y);

  // Prefer phase offsets that often make visually rich figures
  const phases = [0, QUARTER_PI, HALF_PI, PI * 0.75, PI];
  const chosenPhase = random(phases);
  phaseSlider.value(chosenPhase);

  resetAnimation();
}
Line-by-line explanation (5 lines)
const ratio = generateInterestingRatio();
Calls the ratio generator to get a new {x, y} frequency pair.
freqXSlider.value(ratio.x);
Programmatically sets the X frequency slider's position/value, which also visually moves the slider handle in the UI.
const phases = [0, QUARTER_PI, HALF_PI, PI * 0.75, PI];
Defines a short list of phase offsets (in radians) that tend to produce visually rich, non-degenerate Lissajous shapes.
const chosenPhase = random(phases);
Randomly picks one of those phase values from the array.
resetAnimation();
Resets the time and hue so the newly suggested curve starts cleanly with a fresh color.

setup()

setup() runs once and is responsible for all one-time initialization: creating the canvas, switching color modes, building every UI control, and priming the animation state before draw() takes over.

function setup() {
  const cnv = createCanvas(windowWidth, windowHeight);
  cnv.parent('sketch-container');

  // HSB color space makes hue cycling easier
  // https://p5js.org/reference/#/p5/colorMode
  colorMode(HSB, 360, 100, 100, 100);
  strokeCap(ROUND);
  background(0);

  // Sliders: https://p5js.org/reference/#/p5/createSlider
  freqXSlider = createLabeledSlider('X freq', 1, 12, 3, 1);
  freqYSlider = createLabeledSlider('Y freq', 1, 12, 4, 1);
  phaseSlider = createLabeledSlider('Phase', 0, TWO_PI, HALF_PI, 0.01);

  // AI suggestion button
  const btnGroup = createDiv();
  btnGroup.parent('controls');
  btnGroup.addClass('control-group');

  suggestButton = createButton('AI Suggest Curve');
  suggestButton.parent(btnGroup);
  suggestButton.addClass('control-button');
  suggestButton.mousePressed(applyAISuggestion);

  resetAnimation();
}
Line-by-line explanation (8 lines)
const cnv = createCanvas(windowWidth, windowHeight);
Creates a canvas that fills the entire browser window.
cnv.parent('sketch-container');
Places the canvas inside the #sketch-container div so it sits behind the floating control bar.
colorMode(HSB, 360, 100, 100, 100);
Switches from the default RGB color mode to HSB (hue, saturation, brightness, alpha), each ranging 0-360 or 0-100, which makes smoothly cycling colors much easier.
strokeCap(ROUND);
Makes the ends of drawn lines rounded instead of flat/square, giving the neon strokes a softer glow look.
freqXSlider = createLabeledSlider('X freq', 1, 12, 3, 1);
Builds the X-frequency slider, ranging from 1 to 12, starting at 3, moving in whole-number steps.
phaseSlider = createLabeledSlider('Phase', 0, TWO_PI, HALF_PI, 0.01);
Builds the phase slider, ranging from 0 to a full circle (TWO_PI radians), starting at a quarter turn (HALF_PI), with fine 0.01 steps.
suggestButton.mousePressed(applyAISuggestion);
Registers applyAISuggestion() as the function to run whenever the button is clicked.
resetAnimation();
Initializes the time and hue values before the first draw() call runs.

draw()

draw() runs 60 times per second and does the heavy lifting: it reads slider values, layers three separate animation effects (phase wobble, radius breathing, hue drift) on top of the base Lissajous math, then draws the curve as hundreds of tiny connected line segments using additive blending for glow.

🔬 These two lines are the actual Lissajous equations. What happens visually if you change the y line's sin() to cos() - does the whole curve appear rotated or phase-shifted?

    const x = radiusX * sin(freqX * angle + animatedPhase);
    const y = radiusY * sin(freqY * angle);

🔬 This makes the stroke pulse thicker and thinner along the curve over time. What happens if you remove the 'time * 2.5' term so the thickness pattern freezes in place along the curve instead of animating?

      const thickness =
        0.6 + 3.9 * (0.5 + 0.5 * sin(TWO_PI * norm + time * 2.5));
function draw() {
  // Update animation time (normalized-ish “seconds”)
  time += deltaTime * 0.0005;

  // Trail fade: draw a translucent dark layer
  // Use BLEND so we overwrite normally
  blendMode(BLEND);
  noStroke();
  fill(0, 0, 0, 12); // HSB: almost black with a bit more alpha for stronger trails
  rect(0, 0, width, height);

  const freqX = freqXSlider.value();
  const freqY = freqYSlider.value();

  // Slider-controlled base phase
  const basePhase = phaseSlider.value();

  // AUTO-ANIMATION: phase slowly swings around basePhase
  const animatedPhase = basePhase + sin(time * autoPhaseSpeed) * autoPhaseAmount;

  // AUTO-ANIMATION: curve radius “breathes” in and out
  const breathe = 1 + breatheAmount * sin(time * 1.1);

  // Color offset drifts over time (stronger than before)
  hueOffset = (hueOffset + deltaTime * 0.05) % 360;

  // Draw neon Lissajous curve
  push();
  translate(width / 2, height / 2);

  // Additive blending for glow
  // https://p5js.org/reference/#/p5/blendMode
  blendMode(ADD);

  const baseRadiusX = width * 0.32;
  const baseRadiusY = height * 0.32;
  const radiusX = baseRadiusX * breathe;
  const radiusY = baseRadiusY / breathe; // inverse to create subtle distortion

  const points = 1400; // a few more points for smoother curves

  // Enough cycles so closed curves fully form for small integer ratios
  const cycles = max(freqX, freqY);
  const maxT = TWO_PI * cycles;
  const dt = maxT / points;

  let px = null;
  let py = null;

  for (let i = 0; i <= points; i++) {
    const t = i * dt;
    const angle = t + time;

    const x = radiusX * sin(freqX * angle + animatedPhase);
    const y = radiusY * sin(freqY * angle);

    if (px !== null) {
      const norm = i / points;

      // Color along the path: hue cycles with position and time
      // hueOffset drifts, norm adds a gradient along the curve
      const hue = (hueOffset + 360 * norm) % 360;

      // Line thickness variation for extra life
      const thickness =
        0.6 + 3.9 * (0.5 + 0.5 * sin(TWO_PI * norm + time * 2.5));

      strokeWeight(thickness);
      stroke(hue, 90, 100, 80); // high saturation, bright, semi-transparent
      line(px, py, x, y);
    }

    px = x;
    py = y;
  }

  pop();

  // Back to normal blending for HUD text
  blendMode(BLEND);
  drawHUD(freqX, freqY, animatedPhase);
}
Line-by-line explanation (15 lines)

🔧 Subcomponents:

calculation Translucent Trail Overlay fill(0, 0, 0, 12); // HSB: almost black with a bit more alpha for stronger trails

Instead of fully clearing the canvas, paints a mostly-transparent black rectangle so old strokes fade gradually rather than disappearing instantly, creating motion trails.

for-loop Lissajous Point-Stepping Loop for (let i = 0; i <= points; i++) {

Walks along the parametric curve one small step at a time, computing an (x, y) position from two sine waves and drawing a tiny line segment to the previous point.

conditional Skip First Point if (px !== null) {

Avoids trying to draw a line before there's a previous point to connect from, since the very first point in the loop has no predecessor yet.

time += deltaTime * 0.0005;
Advances the animation clock based on real elapsed milliseconds (deltaTime), scaled down so 'time' increases slowly and consistently regardless of frame rate.
fill(0, 0, 0, 12); // HSB: almost black with a bit more alpha for stronger trails
Sets the fill color to near-black with low alpha (12 out of 100) - low enough to be see-through, so previous frames' strokes bleed through rather than vanish.
rect(0, 0, width, height);
Draws that translucent rectangle over the whole canvas, slightly darkening everything drawn in previous frames to create a fading trail effect.
const animatedPhase = basePhase + sin(time * autoPhaseSpeed) * autoPhaseAmount;
Adds a smooth back-and-forth wobble on top of the slider's phase value, using a sine wave so the phase oscillates continuously rather than jumping.
const breathe = 1 + breatheAmount * sin(time * 1.1);
Creates a value that oscillates slightly above and below 1.0, used to scale the curve's radius so it appears to 'breathe' in and out.
hueOffset = (hueOffset + deltaTime * 0.05) % 360;
Continuously increases the base hue over time and wraps it back to 0 once it passes 360, producing an endless color cycle.
blendMode(ADD);
Switches to additive blending, where overlapping colors add their brightness together instead of replacing each other - this is what makes overlapping curve strokes glow brighter.
const cycles = max(freqX, freqY);
Determines how many full oscillation cycles are needed for the curve to close into a complete repeating shape, based on whichever frequency is larger.
for (let i = 0; i <= points; i++) {
Loops through a fixed number of small steps along the curve's total angle range, computing one point per iteration.
const x = radiusX * sin(freqX * angle + animatedPhase);
Calculates the horizontal position using a sine wave oscillating at freqX cycles, offset by the animated phase - this is the classic Lissajous X equation.
const y = radiusY * sin(freqY * angle);
Calculates the vertical position using a sine wave oscillating at freqY cycles - together with x, this traces the Lissajous figure.
if (px !== null) {
Only draws a connecting line segment once there's a previous point (px, py) available to connect from.
const hue = (hueOffset + 360 * norm) % 360;
Computes a hue that shifts gradually along the length of the curve (norm goes from 0 to 1), layered on top of the drifting base hue.
line(px, py, x, y);
Draws a short straight line segment from the previous point to the current point - hundreds of these segments strung together form the smooth curve.
px = x;
Remembers the current point as the 'previous point' for the next loop iteration.

drawHUD()

drawHUD() is called at the end of draw() after switching back to normal BLEND mode, so the informational text isn't affected by the additive glow used for the curve. Using push()/resetMatrix()/pop() lets it draw in fixed screen coordinates regardless of any transforms applied earlier.

function drawHUD(freqX, freqY, phaseShown) {
  push();
  resetMatrix(); // ignore any transforms
  textAlign(LEFT, TOP);
  textSize(12);
  fill(0, 0, 100, 80); // HSB: white, slightly transparent
  noStroke();

  const ratioText = freqX + ' : ' + freqY;
  const phaseDeg = (phaseShown * 180 / PI).toFixed(1);

  text('AI Lissajous Curves', 16, 16);
  text('Ratio X : Y = ' + ratioText, 16, 32);
  text('Animated phase = ' + phaseDeg + '°', 16, 48);
  text('Use sliders or "AI Suggest Curve" for new patterns.', 16, 64);

  pop();
}
Line-by-line explanation (6 lines)
resetMatrix(); // ignore any transforms
Cancels out the earlier translate(width/2, height/2) from draw(), so text is positioned relative to the canvas corner (0,0) instead of the canvas center.
textAlign(LEFT, TOP);
Sets text so it's anchored from its top-left corner at the given coordinates, making it easy to stack lines downward.
fill(0, 0, 100, 80); // HSB: white, slightly transparent
In HSB, (0, 0, 100) is pure white regardless of hue/saturation since brightness is maxed and saturation is zero; alpha 80 makes it slightly see-through.
const ratioText = freqX + ' : ' + freqY;
Builds a display string like '3 : 4' from the current frequency values using string concatenation.
const phaseDeg = (phaseShown * 180 / PI).toFixed(1);
Converts the phase from radians to degrees (a more intuitive unit for most readers) and rounds it to one decimal place.
text('Ratio X : Y = ' + ratioText, 16, 32);
Draws the frequency ratio text 16 pixels from the left and 32 pixels down from the top.

windowResized()

windowResized() is a special p5.js callback that fires automatically on browser resize events, letting full-window sketches stay responsive without any manual event listener setup.

function windowResized() {
  resizeCanvas(windowWidth, windowHeight);
}
Line-by-line explanation (1 lines)
resizeCanvas(windowWidth, windowHeight);
Automatically called by p5.js whenever the browser window is resized; this resizes the canvas to match the new window dimensions so the sketch always fills the screen.

📦 Key Variables

freqXSlider object

Stores the p5.Element for the X-frequency slider so its .value() can be read every frame in draw().

let freqXSlider;
freqYSlider object

Stores the p5.Element for the Y-frequency slider so its .value() can be read every frame in draw().

let freqYSlider;
phaseSlider object

Stores the p5.Element for the phase slider so its .value() can be read every frame in draw().

let phaseSlider;
suggestButton object

Stores the p5.Element for the 'AI Suggest Curve' button so its click handler can be attached.

let suggestButton;
time number

Tracks elapsed animation time, used to drive the phase wobble, radius breathing, and curve motion each frame.

let time = 0;
hueOffset number

Stores the drifting base hue (0-360) used to color the curve, giving it a slowly shifting rainbow palette.

let hueOffset = 0;
autoPhaseAmount number

Sets how far the automatic phase wobble swings, in radians, on top of the slider's phase value.

let autoPhaseAmount = 0.7;
autoPhaseSpeed number

Sets how fast the automatic phase wobble oscillates back and forth.

let autoPhaseSpeed = 0.5;
breatheAmount number

Sets the amplitude of the curve's radius 'breathing' pulse over time.

let breatheAmount = 0.06;

🔧 Potential Improvements (4)

Here are some ways this code could be enhanced:

BUG generateInterestingRatio()

The procedural coprime search loop tries only 20 times and, if it never finds a coprime pair (theoretically possible though unlikely with random(1,12)), silently falls back to whatever the last random a and b happened to be - even if they share a common factor.

💡 Add an explicit fallback like `if (i === 19) { a = 3; b = 4; }` or increase the loop's iteration count so a valid coprime pair is guaranteed.

PERFORMANCE draw()

The curve is drawn using 1400 individual line() calls per frame, each with its own strokeWeight() and stroke() call - this is significantly slower than it needs to be since p5 has to process each segment as a separate draw call.

💡 Use beginShape()/vertex()/endShape() with a single stroke color per shape (or a p5.Graphics buffer) to batch the geometry, which can noticeably improve frame rate especially on lower-end devices.

STYLE draw()

Several 'magic numbers' (0.32 for radius scaling, 0.0005 and 0.05 for time/hue speed, 1.1 and 2.5 for breathing/thickness oscillation) are hard-coded inline, making them harder to find and tune.

💡 Lift these into named constants near the top of the file (like the existing autoPhaseAmount/autoPhaseSpeed/breatheAmount pattern) so all the 'feel' parameters of the animation live in one place.

BUG draw() - radiusY calculation

radiusY is computed as baseRadiusY / breathe, and breathe = 1 + breatheAmount * sin(...). If breatheAmount were ever set to 1.0 or higher (e.g. by someone tweaking the tunable), breathe could reach 0 at certain times, causing radiusY to become Infinity and the curve to disappear or throw rendering artifacts.

💡 Clamp breathe to a safe minimum, e.g. `const breathe = constrain(1 + breatheAmount * sin(time * 1.1), 0.2, 1.8);`, to guarantee it never approaches zero.

🔄 Code Flow

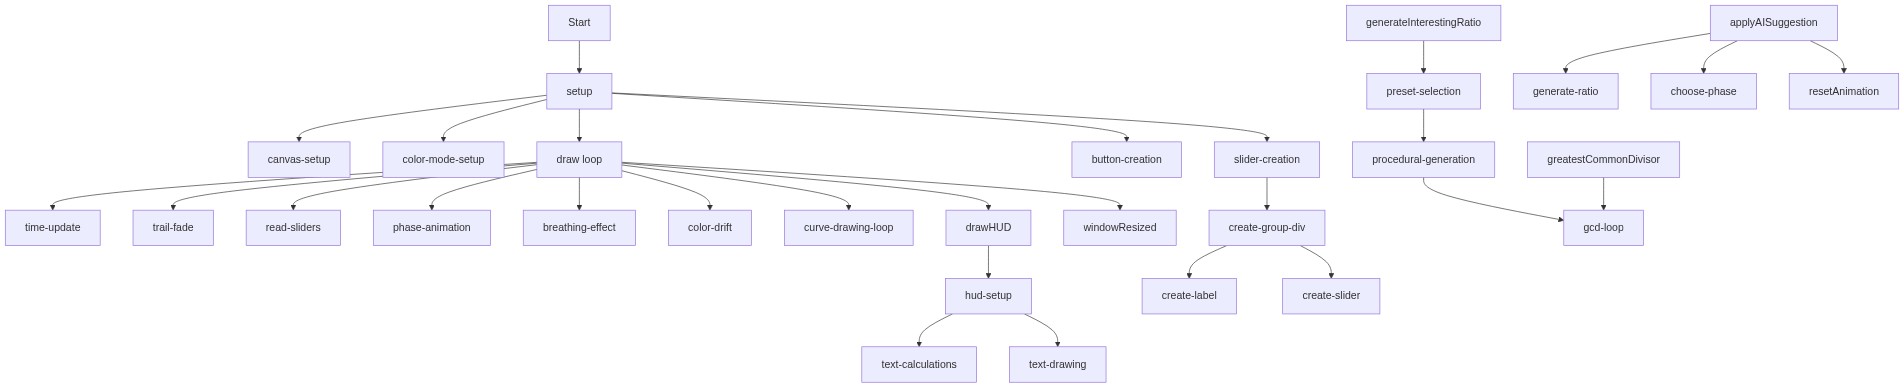
Code flow showing createlabeledslider, greatestcommondivisor, generateinterestingratio, resetanimation, applyaisuggestion, setup, draw, drawhud, windowresized

💡 Click on function names in the diagram to jump to their code

graph TD start[Start] --> setup[setup] setup --> draw[draw loop] draw --> trailfade[trail-fade] draw --> curveloop[curve-loop] draw --> drawhud[drawhud] click setup href "#fn-setup" click draw href "#fn-draw" click trailfade href "#sub-trail-fade" click curveloop href "#sub-curve-loop" curveloop --> segmentconditional[segment-conditional] segmentconditional --> curveloop click segmentconditional href "#sub-segment-conditional" trailfade --> drawhud setup --> createlabeledslider[createlabeledslider] setup --> resetanimation[resetanimation] setup --> applyaisuggestion[applyaisuggestion] setup --> windowresized[windowresized] click createlabeledslider href "#fn-createlabeledslider" click resetanimation href "#fn-resetanimation" click applyaisuggestion href "#fn-applyaisuggestion" click windowresized href "#fn-windowresized" applyaisuggestion --> resetanimation resetanimation --> draw generateinterestingratio[generateinterestingratio] --> greatestcommondivisor[greatestcommondivisor] click generateinterestingratio href "#fn-generateinterestingratio" click greatestcommondivisor href "#fn-greatestcommondivisor" greatestcommondivisor --> gcdwhile[gcd-while] click gcdwhile href "#sub-gcd-while" generateinterestingratio --> presetbranch[preset-branch] click presetbranch href "#sub-preset-branch" presetbranch --> proceduralloop[procedural-loop] click proceduralloop href "#sub-procedural-loop" proceduralloop --> greatestcommondivisor proceduralloop --> draw gcdwhile --> greatestcommondivisor gcdwhile --> draw

❓ Frequently Asked Questions

What kind of visual patterns does the AI Lissajous Curves sketch generate?

The sketch creates beautiful neon harmonic patterns using Lissajous curves, which are intricate and colorful mathematical designs.

How can users customize their experience with the AI Lissajous Curves sketch?

Users can interact with the sketch by adjusting sliders for frequency and phase, and they can also generate interesting frequency ratios using an AI suggestion feature.

What creative coding concepts are demonstrated in the AI Lissajous Curves sketch?

This sketch showcases the use of mathematical concepts like frequency ratios and procedural generation to create dynamic and aesthetically pleasing visual art.

Preview

AI Lissajous Curves - Mathematical Harmonic Art Beautiful neon harmonic patterns created by oscilla - p5.js creative coding sketch preview
Sketch Preview
Code flow diagram showing the structure of AI Lissajous Curves - Mathematical Harmonic Art Beautiful neon harmonic patterns created by oscilla - Code flow showing createlabeledslider, greatestcommondivisor, generateinterestingratio, resetanimation, applyaisuggestion, setup, draw, drawhud, windowresized
Code Flow Diagram