
AI Lissajous Explorer - Mathematical Spirograph Patterns - xelsed.ai

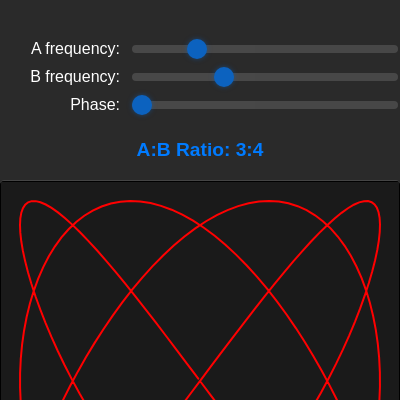
This sketch draws a glowing, colorful Lissajous curve - a classic mathematical spirograph pattern created by combining two sine waves at different frequencies. Three sliders let you control the A and B frequencies and the phase offset, instantly reshaping the curve from a circle into figure-eights and intricate woven patterns.

🧪 Try This!

Experiment with the code by making these changes:

  1. Freeze the trails permanently — Raising the background overlay's opacity makes each frame erase almost all of the previous one, turning the glowing trail effect into a crisp single-frame curve.
  2. Make the curve line bolder — Increasing the stroke weight makes the pattern look like a thick glowing ribbon instead of a thin wire.
  3. Turn the smooth curve into a jagged polygon — Using a much bigger step size for t means far fewer points get sampled, so straight line segments become visible instead of a smooth curve.
Prefer the full editor? Open it there →

📖 About This Sketch

This sketch turns a pair of simple trigonometry equations into a mesmerizing, constantly-redrawn spirograph pattern. Moving the A frequency, B frequency, and Phase sliders reshapes the curve in real time, revealing how small integer ratios like 1:1, 2:3, or 3:4 produce wildly different shapes - from perfect circles to tangled figure-eights. It relies on p5.js techniques like beginShape()/vertex() for custom shape drawing, HSB colorMode() for a rainbow gradient along the curve, and DOM elements like createSlider() for live user controls.

The code is organized into four functions: setup() builds the canvas and creates the slider controls, createControlRow() is a small helper that packages a label and slider together, draw() runs the actual math and rendering every frame, and windowResized() is an empty placeholder for handling window size changes. Studying it teaches you how parametric equations become visual art, how a semi-transparent background rectangle can fake motion trails, and how p5.js DOM functions let you build simple UI without any HTML forms.

⚙️ How It Works

  1. When the sketch loads, setup() creates a 400x400 canvas, switches to HSB color mode for easy rainbow coloring, and builds three sliders (A frequency, B frequency, Phase) plus a text label using p5.js DOM functions.
  2. Every frame, draw() reads the current value of each slider into aFrequency, bFrequency, and phase.
  3. A nearly-transparent dark rectangle is drawn over the whole canvas first - because it doesn't fully cover previous frames, older strokes fade out slowly instead of vanishing instantly, creating a soft trailing glow.
  4. The sketch then loops a parameter t from 0 to TWO_PI in small steps, computing an (x, y) point on the Lissajous curve for each step using sin(aFrequency * t + phase) and sin(bFrequency * t).
  5. Each point is colored with a hue mapped from its position along the loop (t), so the curve is drawn as a smooth rainbow gradient using beginShape()/vertex()/endShape().
  6. Finally the on-screen text is updated to show the current A:B ratio, and because draw() runs continuously, moving any slider immediately reshapes the curve on the next frame.

🎓 Concepts You'll Learn

Parametric curves (Lissajous equations)HSB color modeCustom shapes with beginShape/vertex/endShapeDOM elements (createSlider, createSpan, createDiv)Trail effect via semi-transparent backgroundpush/pop transformation statemap() for value remapping

📝 Code Breakdown

setup()

setup() runs once when the sketch starts. Here it's doing double duty: preparing the canvas for drawing AND building an entire user interface out of p5.js DOM elements (sliders, divs, spans) instead of writing raw HTML.

function setup() {
  // Create a canvas of 400x400 pixels
  canvas = createCanvas(400, 400);
  // Attach the canvas to the 'sketch-container' div in index.html
  // This allows CSS to center both the canvas and its controls together.
  canvas.parent('sketch-container');

  // Set the color mode to HSB (Hue, Saturation, Brightness)
  // Hue: 0-360 degrees (color wheel)
  // Saturation: 0-100% (intensity)
  // Brightness: 0-100% (lightness)
  colorMode(HSB, 360, 100, 100);

  // Disable drawing outlines around shapes (we only want stroke)
  noFill();

  // Set the stroke weight for drawing the curve
  strokeWeight(2); // https://p5js.org/reference/#/p5/strokeWeight

  // Set text properties for displaying the A:B ratio
  textSize(16); // https://p5js.org/reference/#/p5/textSize
  textAlign(CENTER, CENTER); // https://p5js.org/reference/#/p5/textAlign

  // Get the div to hold controls from index.html
  controlsContainer = select('#controls-container'); // https://p5js.org/reference/#/p5/select

  // === Create Sliders ===
  // createSlider(min, max, initial_value, step)
  // Sliders allow users to interactively change parameters.

  // A Frequency Slider (integer values from 1 to 10)
  aSlider = createSlider(1, 10, 3, 1); // https://p5js.org/reference/#/p5/createSlider
  createControlRow('A frequency: ', aSlider); // Helper function to create labeled row

  // B Frequency Slider (integer values from 1 to 10)
  bSlider = createSlider(1, 10, 4, 1);
  createControlRow('B frequency: ', bSlider);

  // Phase Slider (float values from 0 to TWO_PI with 0.01 step)
  // TWO_PI is a p5.js constant for 2 * PI radians (a full circle)
  phaseSlider = createSlider(0, TWO_PI, 0, 0.01);
  createControlRow('Phase: ', phaseSlider);

  // Create a paragraph element to display the A:B ratio
  ratioText = createP(''); // https://p5js.org/reference/#/p5/createP
  ratioText.id('ratio-display'); // Assign an ID for CSS styling
  controlsContainer.child(ratioText); // Add the paragraph to the controls container
}
Line-by-line explanation (10 lines)
canvas = createCanvas(400, 400);
Creates a 400x400 pixel drawing surface and stores a reference to it in the canvas variable.
canvas.parent('sketch-container');
Moves the canvas element into the #sketch-container div in the HTML so CSS can center the canvas together with the sliders below it.
colorMode(HSB, 360, 100, 100);
Switches p5's color system from RGB to Hue-Saturation-Brightness, which makes it much easier to sweep through a rainbow of colors just by changing one hue number.
noFill();
Turns off shape fill so only the stroke (outline) of the curve is visible - important since beginShape()/vertex() would otherwise try to fill in the closed curve.
strokeWeight(2); // https://p5js.org/reference/#/p5/strokeWeight
Sets how thick the lines drawn by stroke() will be, in this case 2 pixels.
controlsContainer = select('#controls-container'); // https://p5js.org/reference/#/p5/select
Grabs a reference to the existing #controls-container div from index.html so new elements can be added inside it.
aSlider = createSlider(1, 10, 3, 1); // https://p5js.org/reference/#/p5/createSlider
Creates an HTML range slider for the A frequency, allowing whole number values from 1 to 10, starting at 3.
createControlRow('A frequency: ', aSlider); // Helper function to create labeled row
Calls the helper function to wrap the slider together with a text label and insert that row into the controls container.
phaseSlider = createSlider(0, TWO_PI, 0, 0.01);
Creates a slider for the phase offset that can take decimal values from 0 up to a full circle (TWO_PI radians), in fine 0.01 steps.
ratioText = createP(''); // https://p5js.org/reference/#/p5/createP
Creates an empty paragraph element that will later display the current A:B frequency ratio as text.
createControlRow()

This helper function avoids repeating the same four lines of DOM setup code three times in setup(). Writing small reusable functions like this - even for non-drawing tasks - is a core programming habit worth building early.

function createControlRow(label, slider) {
  let rowContainer = createDiv(''); // https://p5js.org/reference/#/p5/createDiv
  rowContainer.class('control-row'); // Add a class for CSS styling // https://p5js.org/reference/#/p5.Element/class

  let labelSpan = createSpan(label); // https://p5js.org/reference/#/p5/createSpan
  rowContainer.child(labelSpan); // Add label to the row container // https://p5js.org/reference/#/p5.Element/child
  rowContainer.child(slider); // Add slider to the row container

  controlsContainer.child(rowContainer); // Add the complete row to the main controls container
}
Line-by-line explanation (6 lines)
let rowContainer = createDiv(''); // https://p5js.org/reference/#/p5/createDiv
Creates a new empty <div> element to act as a horizontal row wrapping one label and one slider.
rowContainer.class('control-row'); // Add a class for CSS styling // https://p5js.org/reference/#/p5.Element/class
Assigns the CSS class 'control-row' to the div so style.css can lay it out as a flex row with spacing.
let labelSpan = createSpan(label); // https://p5js.org/reference/#/p5/createSpan
Creates a small inline text element containing the label string, like 'A frequency: '.
rowContainer.child(labelSpan); // Add label to the row container // https://p5js.org/reference/#/p5.Element/child
Nests the label span inside the row div so they display together.
rowContainer.child(slider); // Add slider to the row container
Nests the slider element right after the label inside the same row div.
controlsContainer.child(rowContainer); // Add the complete row to the main controls container
Adds the finished label+slider row into the main controls container, stacking each new row below the previous one.

draw()

draw() is where the actual mathematics of the Lissajous curve comes to life every single frame. It demonstrates how parametric equations (two independent functions of a shared variable t) can trace complex 2D shapes, and how push()/translate()/pop() let you temporarily shift the coordinate system without disturbing the rest of your drawing code.

🔬 Both x and y currently use sin(). What happens if you change the y line to use cos(bFrequency * t) instead? Try it and watch how the curve's starting point and overall symmetry shift.

    let x = sin(aFrequency * t + phase) * (width / 2 - 20); // https://p5js.org/reference/#/p5/sin
    let y = sin(bFrequency * t) * (height / 2 - 20);

🔬 This loop's step size (0.02) controls how many points make up the curve. What happens if you increase it to 0.5? The smooth curve should turn into a rough, angular polygon because far fewer points get connected.

  for (let t = 0; t <= TWO_PI; t += 0.02) {
    // Parametric equations for Lissajous curve
    // x = A * sin(a*t + phase)
    // y = B * sin(b*t)
function draw() {
  // === Update Parameters from Sliders ===
  aFrequency = aSlider.value(); // Get current value from slider // https://p5js.org/reference/#/p5.Element/value
  bFrequency = bSlider.value();
  phase = phaseSlider.value();

  // === Background Trail Effect ===
  // Draw a semi-transparent rectangle over the entire canvas each frame.
  // This creates a subtle fading trail effect for the Lissajous curve.
  // fill(hue, saturation, brightness, alpha)
  // HSB: hue=0, sat=0, bright=10 (very dark gray), alpha=5 (5% opacity)
  fill(0, 0, 10, 5); // https://p5js.org/reference/#/p5/fill
  rect(0, 0, width, height); // https://p5js.org/reference/#/p5/rect

  // === Draw the Lissajous Curve ===

  // push() saves the current drawing state (transformations, colors, etc.)
  push(); // https://p5js.org/reference/#/p5/push

  // translate() moves the origin (0,0) of the canvas to the center
  // Now, all subsequent drawing commands will be relative to the canvas center.
  translate(width / 2, height / 2); // https://p5js.org/reference/#/p5/translate

  // beginShape() and endShape() are used to draw custom shapes by connecting vertices
  beginShape(); // https://p5js.org/reference/#/p5/beginShape
  // Loop 't' (parameter) from 0 to TWO_PI (a full cycle) with small steps (0.02 radians)
  // Smaller steps result in a smoother curve.
  for (let t = 0; t <= TWO_PI; t += 0.02) {
    // Parametric equations for Lissajous curve
    // x = A * sin(a*t + phase)
    // y = B * sin(b*t)
    // We scale the x and y values to fit within the canvas, with a small padding (20 pixels from edge)
    let x = sin(aFrequency * t + phase) * (width / 2 - 20); // https://p5js.org/reference/#/p5/sin
    let y = sin(bFrequency * t) * (height / 2 - 20);

    // Set stroke color for the current vertex
    // The hue is mapped from 't' (0 to TWO_PI) to the full HSB hue range (0 to 360),
    // creating a beautiful colorful gradient along the curve.
    stroke(map(t, 0, TWO_PI, 0, 360), 100, 100); // https://p5js.org/reference/#/p5/stroke // https://p5js.org/reference/#/p5/map

    // Add a vertex (point) to the custom shape
    vertex(x, y); // https://p5js.org/reference/#/p5/vertex
  }
  // endShape() completes the shape.
  endShape(); // https://p5js.org/reference/#/p5/endShape

  // pop() restores the drawing state that was saved by push()
  // This ensures transformations applied for the curve don't affect subsequent drawings.
  pop(); // https://p5js.org/reference/#/p5/pop

  // === Display A:B Ratio ===
  // Update the text content of the ratioText paragraph
  ratioText.html(`A:B Ratio: ${aFrequency}:${bFrequency}`); // https://p5js.org/reference/#/p5.Element/html
}
Line-by-line explanation (14 lines)

🔧 Subcomponents:

calculation Read Slider Values aFrequency = aSlider.value();

Pulls the current numeric value out of each HTML slider so the math below always uses the latest user input.

calculation Fading Trail Overlay fill(0, 0, 10, 5); rect(0, 0, width, height);

Paints a nearly-invisible dark rectangle over everything, which very slowly erases old strokes instead of instantly clearing them - the classic 'motion trail' trick.

for-loop Lissajous Point Loop for (let t = 0; t <= TWO_PI; t += 0.02) { ... }

Walks a parameter t around a full circle, computing one (x, y) point and one rainbow color per step, and adding it as a vertex of the shape.

aFrequency = aSlider.value(); // Get current value from slider // https://p5js.org/reference/#/p5.Element/value
Reads whatever number the A frequency slider is currently set to and stores it for use in this frame's math.
fill(0, 0, 10, 5); // https://p5js.org/reference/#/p5/fill
Sets the fill color to a nearly-black, almost fully transparent gray (only 5% opacity) that will be used for the next rectangle.
rect(0, 0, width, height); // https://p5js.org/reference/#/p5/rect
Draws that translucent rectangle over the whole canvas - because it's only 5% opaque, previous frames show through faintly, creating a fading trail.
push(); // https://p5js.org/reference/#/p5/push
Saves the current drawing settings (like the origin position) so they can be restored later without affecting other drawing.
translate(width / 2, height / 2); // https://p5js.org/reference/#/p5/translate
Shifts the coordinate system so (0,0) is now the center of the canvas, making the curve math simpler and naturally centered.
beginShape(); // https://p5js.org/reference/#/p5/beginShape
Starts recording a custom multi-point shape; every vertex() call from here until endShape() becomes part of one connected line.
for (let t = 0; t <= TWO_PI; t += 0.02) {
Loops the parameter t from 0 all the way around a full circle (TWO_PI radians), advancing by tiny 0.02 steps to sample enough points for a smooth curve.
let x = sin(aFrequency * t + phase) * (width / 2 - 20); // https://p5js.org/reference/#/p5/sin
Computes the horizontal position of this point using a sine wave whose frequency is aFrequency and whose timing is shifted by phase, scaled to fit inside the canvas with 20px of padding.
let y = sin(bFrequency * t) * (height / 2 - 20);
Computes the vertical position using a second, independent sine wave at frequency bFrequency - the interplay between these two waves is what creates the Lissajous pattern.
stroke(map(t, 0, TWO_PI, 0, 360), 100, 100); // https://p5js.org/reference/#/p5/stroke // https://p5js.org/reference/#/p5/map
Converts the current position in the loop (t) into a hue value from 0-360 using map(), so the color smoothly cycles through the rainbow as the curve is drawn.
vertex(x, y); // https://p5js.org/reference/#/p5/vertex
Adds this (x, y) point, with its current stroke color, as the next point of the custom shape.
endShape(); // https://p5js.org/reference/#/p5/endShape
Finishes the custom shape, connecting all the recorded vertices into visible line segments.
pop(); // https://p5js.org/reference/#/p5/pop
Restores the drawing state saved earlier by push(), undoing the translate() so later code isn't affected by the shifted origin.
ratioText.html(`A:B Ratio: ${aFrequency}:${bFrequency}`); // https://p5js.org/reference/#/p5.Element/html
Updates the text of the paragraph element below the sliders to show the current A:B frequency ratio, like 'A:B Ratio: 3:4'.

windowResized()

windowResized() is a p5.js lifecycle function that fires on browser resize, similar to how setup() fires once and draw() fires every frame. Leaving it empty is a valid choice when you want a fixed-size sketch that stays centered via CSS instead of dynamically resizing.

function windowResized() {
  // If you wanted the canvas to fill the window, you would use:
  // resizeCanvas(windowWidth, windowHeight); // https://p5js.org/reference/#/p5/resizeCanvas
  // And then adjust scaling for the Lissajous curve based on new width/height.
}
Line-by-line explanation (2 lines)
function windowResized() {
This is a special p5.js callback that automatically runs whenever the browser window is resized.
// resizeCanvas(windowWidth, windowHeight); // https://p5js.org/reference/#/p5/resizeCanvas
This commented-out line shows how you WOULD resize the canvas to fill the window, but it's left inactive here since the sketch uses a fixed 400x400 canvas centered by CSS.

📦 Key Variables

aFrequency number

The current A frequency value read from aSlider each frame; controls how fast the horizontal (x) sine wave oscillates.

let aFrequency;
bFrequency number

The current B frequency value read from bSlider each frame; controls how fast the vertical (y) sine wave oscillates.

let bFrequency;
phase number

A phase offset (in radians) read from phaseSlider that shifts the x-wave in time, rotating and reshaping the curve.

let phase;
aSlider object

The p5.js DOM slider element the user drags to change aFrequency.

let aSlider;
bSlider object

The p5.js DOM slider element the user drags to change bFrequency.

let bSlider;
phaseSlider object

The p5.js DOM slider element the user drags to change the phase offset.

let phaseSlider;
ratioText object

A paragraph DOM element that displays the current A:B frequency ratio as text.

let ratioText;
controlsContainer object

A reference to the HTML div that holds all sliders and the ratio text, used to organize the DOM UI.

let controlsContainer;
canvas object

Stores the p5.js canvas element so it can be reparented into the sketch-container div.

let canvas;

🔧 Potential Improvements (4)

Here are some ways this code could be enhanced:

PERFORMANCE draw()

The for-loop recalculates sin(), map(), and creates a new vertex roughly 314 times every single frame (60 times per second), even when the sliders haven't moved.

💡 Cache the computed points in an array and only recompute them when aFrequency, bFrequency, or phase actually change, redrawing the cached array otherwise.

STYLE setup()

Magic numbers like the 20-pixel padding and the 10/5 trail color values are scattered inline with no named explanation beyond comments.

💡 Pull these into named constants like const EDGE_PADDING = 20 or const TRAIL_ALPHA = 5 at the top of the file so they're easy to find and tune.

FEATURE draw() / phaseSlider

The phase only changes when the user manually drags the slider, so the curve is otherwise static aside from redraws.

💡 Add an auto-animate option (e.g. a checkbox) that increments phase by a small amount each frame using frameCount, so the pattern continuously morphs without user input.

BUG windowResized()

The function is empty, which is fine for a fixed canvas, but on very small mobile screens the 400x400 canvas plus controls may overflow the viewport since there's no responsive fallback.

💡 Consider using resizeCanvas() with a min() of windowWidth and a fixed max size, and recalculating the curve's padding based on the new width/height.

🔄 Code Flow

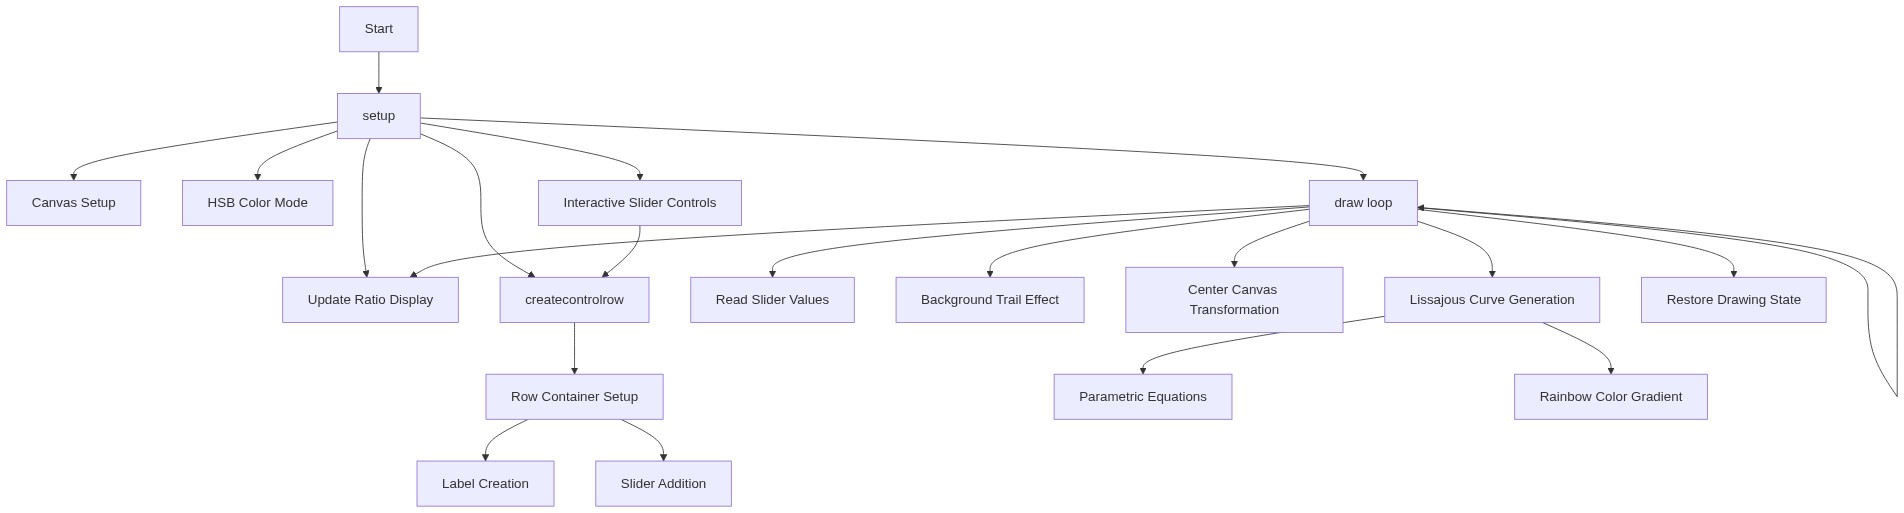
Code flow showing setup, createcontrolrow, draw, windowresized

💡 Click on function names in the diagram to jump to their code

graph TD start[Start] --> setup[setup] setup --> createcontrolrow[createcontrolrow] createcontrolrow --> draw[draw loop] draw --> readsliders[read-sliders] draw --> traileffect[trail-effect] draw --> curveloop[curve-loop] curveloop --> draw click setup href "#fn-setup" click createcontrolrow href "#fn-createcontrolrow" click draw href "#fn-draw" click readsliders href "#sub-read-sliders" click traileffect href "#sub-trail-effect" click curveloop href "#sub-curve-loop"

❓ Frequently Asked Questions

What visual patterns can I create with the AI Lissajous Explorer?

This sketch generates intricate spirograph patterns based on Lissajous curves, showcasing a variety of shapes such as circles, figure-8s, and complex weaving designs.

How can I interact with the AI Lissajous Explorer sketch?

Users can adjust the A and B frequency sliders and change the phase slider to dynamically alter the shape and animation of the spirograph patterns.

What creative coding concept does the AI Lissajous Explorer demonstrate?

The sketch illustrates the mathematical principles of Lissajous curves, exploring how frequency ratios and phase shifts influence the resulting visual patterns.

Preview

AI Lissajous Explorer - Mathematical Spirograph Patterns - xelsed.ai - p5.js creative coding sketch preview
Sketch Preview
Code flow diagram showing the structure of AI Lissajous Explorer - Mathematical Spirograph Patterns - xelsed.ai - Code flow showing setup, createcontrolrow, draw, windowresized
Code Flow Diagram