AI Melting Clock - Dali-Inspired Surreal Time Display

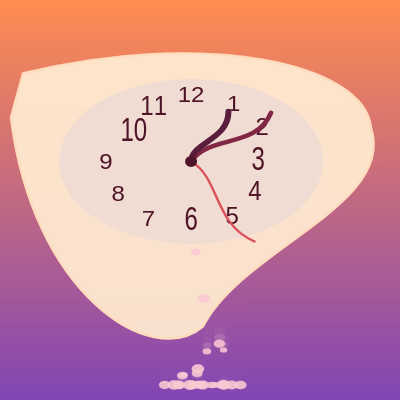
This sketch draws a Salvador Dali-style 'Persistence of Memory' clock that lives inside a warm sunset-to-purple gradient. The clock face, its hour numbers, and its hands constantly wobble and droop using Perlin noise, while pink drops periodically ooze off the bottom of the clock and fall like melting wax.

🧪 Try This!

Experiment with the code by making these changes:

  1. Speed up the melting animation — Increasing the noise time-multiplier makes every wobbling part of the clock shift and jitter noticeably faster.
  2. Make it melt way more dramatically — Widening the wobble range pushes the clock outline, numbers, and hands to sag and bend much further.
  3. Turn on constant heavy dripping — Raising the minimum and maximum spawn chance makes drops pour off the clock continuously instead of only near the end of each minute.
  4. Swap the sunset for an icy sky — Changing the two gradient colors instantly re-themes the whole background from warm sunset tones to a cold blue night.
Prefer the full editor? Open it there →

📖 About This Sketch

This sketch turns a normal analog clock into a surreal, melting Dali-style timepiece: the clock's blobby outline, its twelve hour numbers, and its three hands all wobble and sag as if made of soft wax, while pink droplets periodically break away and drip down the screen. It relies on three core p5.js techniques - Perlin noise (noise()) for organic, non-random-looking wobble, bezierVertex()/bezier() for the warped clock outline and drooping hands, and the built-in second()/minute()/hour() functions so the hands actually show real time. A simple particle system (the drops array) adds falling, bouncing droplets to sell the 'melting' illusion.

The code is split into small helper functions: wob() generates the wobble value used everywhere, drawBg() paints the gradient sky, hand() draws one wobbly clock hand as a bezier curve, drawClock() assembles the whole face (outline, numbers, hands), and updateDrops() spawns, animates, and cleans up the dripping particles; draw() simply calls all of them every frame. Studying this sketch teaches you how to reuse one noise-based helper function to animate many different shapes consistently, how bezier curves can fake soft, organic materials, and how to build a lightweight particle system with a JavaScript array of plain objects.

⚙️ How It Works

  1. On load, setup() creates a full-window canvas, centers text alignment, and turns off default strokes so each drawing function can set its own stroke as needed.
  2. Every frame, draw() first calls drawBg() to paint a row-by-row gradient from orange at the top to purple at the bottom, giving the dreamlike sunset backdrop.
  3. drawClock() then translates to the center of the screen, applies a gentle noise-driven offset and stretch, and draws an irregular blob shape for the clock body using bezierVertex() with each control point nudged by wob() so the outline never sits still.
  4. Inside the same function, a loop draws each hour number 1-12 at its normal clock position but shifts and vertically stretches it based on another wob() value, creating the sliding, melting-digit effect; three calls to hand() then draw the second, minute, and hour hands using the real system time and the same bezier-wobble trick.
  5. updateDrops() runs last: based on the current seconds value it occasionally spawns a new drop object near the bottom of the clock, then loops through every existing drop applying gravity, a little noise-based side-to-side sway, and a soft bounce when it nears the bottom of the screen, drawing each as a squashed pink ellipse.
  6. Finally, drops that have fallen off the bottom of the canvas are filtered out of the array so it never grows without bound, and windowResized() keeps the canvas matching the browser window if it's resized.

🎓 Concepts You'll Learn

Perlin noise for organic animationBezier curves for soft/warped shapesTrigonometry for clock hand/number positionsReal-time clock functions (second/minute/hour)Particle systems with arrays of objectsColor interpolation (lerpColor) for gradientspush()/pop() transform isolation

📝 Code Breakdown

setup()

setup() runs exactly once when the sketch starts. It's the right place to configure the canvas and any drawing defaults (like text alignment) that should apply for the rest of the sketch.

function setup(){createCanvas(windowWidth,windowHeight);textAlign(CENTER,CENTER);noStroke();}
Line-by-line explanation (3 lines)
createCanvas(windowWidth,windowHeight);
Creates a canvas that fills the entire browser window.
textAlign(CENTER,CENTER);
Makes any text drawn later center itself on the x,y point you give it - important for the hour numbers to sit neatly in place.
noStroke();
Turns off outlines by default; individual drawing functions turn stroke back on only where they need it.

wob()

wob() is a reusable 'randomness' function shared by every other function in the sketch. Centralizing noise logic like this is a common p5.js pattern - write one small helper, then call it with different seed numbers everywhere you want organic motion.

🔬 This single line drives every wobble in the sketch. What happens if you change 0.02 to 0.001 (much slower) versus 0.2 (much faster)? And what happens if -1.5,1.5 becomes -0.2,0.2 (barely any wobble)?

function wob(a){return map(noise(a,frameCount*0.02),0,1,-1.5,1.5);}
Line-by-line explanation (2 lines)
noise(a,frameCount*0.02)
Perlin noise is smooth pseudo-randomness. Passing a different 'a' value gives each caller its own independent-looking noise stream, while frameCount*0.02 as the second input makes every stream slowly evolve over time.
map(...,0,1,-1.5,1.5)
noise() returns values between 0 and 1; map() rescales that into -1.5 to 1.5 so the result can be added to a shape's coordinates to push it left/right or up/down.

drawBg()

drawBg() shows a simple but powerful trick: instead of relying on a built-in gradient function, you can paint a gradient yourself by drawing many thin lines, each with a color computed from lerpColor(). This technique works for any two-color gradient in any direction.

🔬 This is where the two gradient colors get mixed. What happens if you swap color(130,70,180) for something icy like color(20,20,80), turning the sunset into a midnight sky?

let c=lerpColor(color(255,140,80),color(130,70,180),n);stroke(c);line(0,y,width,y);
function drawBg(){for(let y=0;y<height;y++){let n=y/height;let c=lerpColor(color(255,140,80),color(130,70,180),n);stroke(c);line(0,y,width,y);}noStroke();}
Line-by-line explanation (6 lines)

🔧 Subcomponents:

for-loop Gradient Row Loop for(let y=0;y<height;y++){...}

Walks down the canvas one pixel row at a time so each row can be painted a slightly different blended color, creating a smooth vertical gradient.

for(let y=0;y<height;y++){
Loops through every single row of pixels from the top (y=0) to the bottom (y=height).
let n=y/height;
Converts the current row into a fraction between 0 (top) and 1 (bottom).
let c=lerpColor(color(255,140,80),color(130,70,180),n);
Blends orange and purple based on n - near the top n is close to 0 so it's mostly orange, near the bottom n is close to 1 so it's mostly purple.
stroke(c);
Sets the line color to this row's blended color.
line(0,y,width,y);
Draws a full-width horizontal line at this row, which is how the gradient actually gets painted.
noStroke();
Turns stroke back off after the loop so it doesn't accidentally outline shapes drawn later.

hand()

hand() is a reusable helper called three times (once per hand) with different lengths, colors, and wobble seeds. This is a great example of writing one flexible function instead of repeating nearly-identical code three times.

🔬 The '*10' at the end of each term controls how far the control points wander from a straight line. What happens if you change all four *10 to *40? What if you change them to *0?

let c1x=cos(ang-0.5)*len*0.3+wob(s)*10,c1y=sin(ang-0.5)*len*0.3+wob(s+10)*10,c2x=cos(ang+0.4)*len*0.7+wob(s+20)*10,c2y=sin(ang+0.4)*len*0.7+wob(s+30)*10;
function hand(len,ang,s,col,w){stroke(col);strokeWeight(w);noFill();let x=cos(ang)*len,y=sin(ang)*len;let c1x=cos(ang-0.5)*len*0.3+wob(s)*10,c1y=sin(ang-0.5)*len*0.3+wob(s+10)*10,c2x=cos(ang+0.4)*len*0.7+wob(s+20)*10,c2y=sin(ang+0.4)*len*0.7+wob(s+30)*10;bezier(0,0,c1x,c1y,c2x,c2y,x,y);}
Line-by-line explanation (4 lines)

🔧 Subcomponents:

calculation Hand Tip Position let x=cos(ang)*len,y=sin(ang)*len;

Uses basic trigonometry to find where the tip of the hand should be, given an angle and length.

calculation Wobbly Control Points let c1x=cos(ang-0.5)*len*0.3+wob(s)*10,c1y=sin(ang-0.5)*len*0.3+wob(s+10)*10,c2x=cos(ang+0.4)*len*0.7+wob(s+20)*10,c2y=sin(ang+0.4)*len*0.7+wob(s+30)*10;

Computes two bezier control points offset from a straight line by wob(), so the hand bends and sags instead of staying rigid.

stroke(col);strokeWeight(w);noFill();
Sets the hand's color and thickness, and makes sure it's drawn as an open curve with no fill.
let x=cos(ang)*len,y=sin(ang)*len;
Standard trigonometry: given an angle and a length, cos(ang)*len and sin(ang)*len give the x,y position of the hand's tip relative to the clock's center.
let c1x=cos(ang-0.5)*len*0.3+wob(s)*10,c1y=sin(ang-0.5)*len*0.3+wob(s+10)*10,c2x=cos(ang+0.4)*len*0.7+wob(s+20)*10,c2y=sin(ang+0.4)*len*0.7+wob(s+30)*10;
Calculates two 'control points' slightly off to either side of the straight path to the tip, each nudged by its own wob() call so the curve gently bends and drifts over time.
bezier(0,0,c1x,c1y,c2x,c2y,x,y);
Draws a bezier curve starting at the clock center (0,0), bending through the two control points, and ending at the tip - this curve, rather than a straight line, is what makes the hand look soft and droopy.

drawClock()

drawClock() is the heart of the sketch - it combines custom bezier shapes, a positioning loop, and real p5.js clock functions (second/minute/hour) all inside one push()/pop() block so none of its transforms leak into other drawings.

🔬 These three lines shape the melting clock outline. Each wob() call is multiplied by a small number (20, 10, 15, 10, 10, 15). What happens if you double all of them so the blob warps far more violently?

bezierVertex(0+wob(3)*20,-120,140+wob(4)*10,-90,150,-30);
bezierVertex(170+wob(5)*15,40,40+wob(6)*10,80,10,150);
bezierVertex(-30+wob(7)*10,190,-130+wob(8)*15,120,-150,-40);

🔬 This loop draws all 12 hour numbers. What happens if you change i<=12 to i<=6, so only half the numbers are drawn? What if wob(20+i)*18 becomes wob(20+i)*60 for way more droop?

fill(80,20,40);for(let i=1;i<=12;i++){let a=TWO_PI*i/12-HALF_PI;let sl=wob(20+i)*18;let r=70+sl;let x=cos(a)*r,y=sin(a)*(60+sl*0.4);push();translate(x,y+max(0,sl));scale(1,1+abs(sl)/30);textSize(20);text(i,0,0);pop();}
function drawClock(){push();translate(width/2+wob(1)*15,height/2-40+wob(2)*8);scale(1.2,1.1);fill(255,235,210,235);stroke(255,220,190);strokeWeight(2);
beginShape();
vertex(-140,-80);
bezierVertex(0+wob(3)*20,-120,140+wob(4)*10,-90,150,-30);
bezierVertex(170+wob(5)*15,40,40+wob(6)*10,80,10,150);
bezierVertex(-30+wob(7)*10,190,-130+wob(8)*15,120,-150,-40);
endShape(CLOSE);
noStroke();fill(240,220,210);ellipse(0,0,220,150);
fill(80,20,40);for(let i=1;i<=12;i++){let a=TWO_PI*i/12-HALF_PI;let sl=wob(20+i)*18;let r=70+sl;let x=cos(a)*r,y=sin(a)*(60+sl*0.4);push();translate(x,y+max(0,sl));scale(1,1+abs(sl)/30);textSize(20);text(i,0,0);pop();}
let s=second(),m=minute(),h=hour()%12;
let sa=TWO_PI*s/60-HALF_PI,ma=TWO_PI*(m/60+s/3600)-HALF_PI,ha=TWO_PI*((h+m/60)/12)-HALF_PI;
hand(90,sa,40,color(220,80,90),2);hand(80,ma,60,color(130,40,70),4);hand(55,ha,80,color(90,30,60),5);
fill(80,20,40);noStroke();ellipse(0,0,10,10);pop();}

Line-by-line explanation (10 lines)

🔧 Subcomponents:

calculation Wobbly Clock Outline bezierVertex(0+wob(3)*20,-120,140+wob(4)*10,-90,150,-30);

Builds the melting, irregular blob shape of the clock body using bezier curves whose control points shift constantly via wob().

for-loop Melting Hour Numbers for(let i=1;i<=12;i++){let a=TWO_PI*i/12-HALF_PI;let sl=wob(20+i)*18;...}

Positions, droops, and vertically stretches each of the 12 hour numbers so they look like they're sliding down the clock face.

calculation Real-Time Hand Angles let sa=TWO_PI*s/60-HALF_PI,ma=TWO_PI*(m/60+s/3600)-HALF_PI,ha=TWO_PI*((h+m/60)/12)-HALF_PI;

Converts the actual system seconds/minutes/hours into radian angles so the hands point to the correct real-world time.

push();
Saves the current drawing state (position, scale, etc.) so everything inside this function can be undone cleanly at the end.
translate(width/2+wob(1)*15,height/2-40+wob(2)*8);
Moves the origin to roughly the center of the screen, then adds a gentle wobble offset so the whole clock softly drifts in place.
scale(1.2,1.1);
Stretches everything drawn afterward slightly wider than tall, giving the clock a subtly warped proportion.
beginShape(); ... endShape(CLOSE);
Builds one continuous custom shape for the clock's outline using bezierVertex() calls, each with coordinates nudged by wob() so the outline never sits perfectly still.
noStroke();fill(240,220,210);ellipse(0,0,220,150);
Draws the flattened oval clock face on top of the blob outline in a slightly lighter cream tone.
for(let i=1;i<=12;i++){...}
Loops through numbers 1 to 12, computing each one's clock-face angle (a), a wobble amount (sl), and its final wobbled position and vertical stretch, then draws the digit - this is the core of the 'melting numbers' effect.
let s=second(),m=minute(),h=hour()%12;
Reads the real current time from the system clock so the hands are always accurate.
let sa=TWO_PI*s/60-HALF_PI,ma=TWO_PI*(m/60+s/3600)-HALF_PI,ha=TWO_PI*((h+m/60)/12)-HALF_PI;
Converts seconds/minutes/hours into angles in radians, subtracting HALF_PI so that 0 seconds/minutes/hours points straight up like a real clock.
hand(90,sa,40,color(220,80,90),2);hand(80,ma,60,color(130,40,70),4);hand(55,ha,80,color(90,30,60),5);
Draws the second, minute, and hour hands by calling the hand() helper with different lengths, angles, colors, and thicknesses.
fill(80,20,40);noStroke();ellipse(0,0,10,10);pop();
Draws a small dark dot at the center where all the hands pivot, then restores the saved drawing state with pop().

updateDrops()

updateDrops() is a small particle system: it spawns objects into an array, updates their physics every frame, draws them, and removes the ones that are no longer needed. This spawn-update-draw-cleanup pattern is used in nearly every particle effect in creative coding, from rain to fireworks to smoke.

🔬 The spawn chance ramps from 0.01 to 0.4 across each minute. What happens if you change those to 0.5 and 0.9 so drops pour out constantly, or to 0 and 0.02 so they barely ever appear?

if(random()<map(sec,0,59,0.01,0.4)){drops.push({x:width/2+wob(100)*40+random(-20,20),y:height/2+40,v:random(1,3),r:random(5,10)});}
function updateDrops(){let sec=second();if(random()<map(sec,0,59,0.01,0.4)){drops.push({x:width/2+wob(100)*40+random(-20,20),y:height/2+40,v:random(1,3),r:random(5,10)});}
for(let d of drops){d.y+=d.v;d.v+=0.15;d.x+=wob(d.y*0.02)*0.5;if(d.y>height-15){d.y=height-15;d.v*=-0.3;d.x+=random(-1,1);}fill(250,200,210,220);noStroke();ellipse(d.x,d.y,d.r*1.4,d.r);}
drops=drops.filter(d=>d.y<height+40);}
Line-by-line explanation (9 lines)

🔧 Subcomponents:

conditional Random Drop Spawner if(random()<map(sec,0,59,0.01,0.4)){drops.push({...});}

Randomly creates a new falling drop, with the chance increasing from 1% to 40% as the seconds count up through the minute.

for-loop Drop Physics & Drawing Loop for(let d of drops){d.y+=d.v;d.v+=0.15;...}

Moves each drop downward, accelerates it like gravity, adds a small sideways sway, bounces it off the bottom, and draws it.

calculation Off-Screen Cleanup drops=drops.filter(d=>d.y<height+40);

Removes drops that have fallen past the bottom of the canvas so the array doesn't grow forever.

let sec=second();
Gets the current seconds value (0-59) from the system clock.
if(random()<map(sec,0,59,0.01,0.4)){
Rolls a random chance to spawn a new drop this frame; map() converts the current seconds into a probability that climbs from 1% to 40% across the minute, so drops appear more often as the minute progresses.
drops.push({x:width/2+wob(100)*40+random(-20,20),y:height/2+40,v:random(1,3),r:random(5,10)});
Adds a new drop object to the array with a starting position near the bottom of the clock, a small random initial fall speed (v), and a random radius (r).
for(let d of drops){
Loops through every drop currently in the array to update and draw it.
d.y+=d.v;d.v+=0.15;
Moves the drop down by its current speed, then increases that speed slightly - this simulates gravity accelerating the fall.
d.x+=wob(d.y*0.02)*0.5;
Nudges the drop sideways using the shared wob() noise function, based on its height, so it doesn't fall in a perfectly straight line.
if(d.y>height-15){d.y=height-15;d.v*=-0.3;d.x+=random(-1,1);}
When a drop nears the bottom of the screen, it's clamped in place, its velocity is reversed and dampened (creating a soft bounce), and it gets a tiny random horizontal jiggle, mimicking a droplet settling into a puddle.
fill(250,200,210,220);noStroke();ellipse(d.x,d.y,d.r*1.4,d.r);
Draws each drop as a light pink ellipse that's wider than it is tall, giving it a squished droplet shape.
drops=drops.filter(d=>d.y<height+40);
Keeps only the drops still near or above the visible canvas, discarding any that have drifted far below it - this prevents the array from growing without limit over time.

draw()

draw() runs continuously, about 60 times per second, and is intentionally kept tiny here - it just calls three well-named helper functions in order. This is good practice: keep draw() readable as a high-level summary of what happens each frame, and push details into separate functions.

function draw(){drawBg();drawClock();updateDrops();}
Line-by-line explanation (3 lines)
drawBg();
Repaints the sunset-to-purple gradient every frame, which also clears away last frame's drawing (there's no separate background() call - the gradient itself acts as the clear).
drawClock();
Draws the entire melting clock: outline, face, numbers, and hands, all freshly wobbled for this frame.
updateDrops();
Spawns any new drips, moves and draws all existing ones, and removes drops that have fallen off-screen.

windowResized()

windowResized() is a special p5.js event function, similar to setup() and draw(), that p5 calls automatically whenever the browser window is resized. Pairing it with windowWidth/windowHeight is the standard way to make a sketch responsive.

function windowResized(){resizeCanvas(windowWidth,windowHeight);}
Line-by-line explanation (1 lines)
resizeCanvas(windowWidth,windowHeight);
A built-in p5.js function that automatically fires whenever the browser window changes size; this line resizes the canvas to match, keeping the clock full-screen.

📦 Key Variables

drops array

Holds every currently-falling drop as a plain object with x, y, v (velocity) and r (radius) properties; new drops are pushed in by updateDrops() and old ones are filtered out once they fall off-screen.

let drops=[];

🔧 Potential Improvements (4)

Here are some ways this code could be enhanced:

PERFORMANCE drawBg()

The background is repainted by calling line() once for every single pixel row of the canvas, every single frame - on a tall 1080p+ window that's over a thousand draw calls just for the backdrop.

💡 Pre-render the gradient once into an offscreen graphics buffer with createGraphics() (or use the canvas's native drawingContext.createLinearGradient) and simply image() it onto the canvas each frame instead of redrawing every row.

BUG updateDrops()

New drops spawn at a fixed 'width/2+wob(100)*40' but the clock itself is drawn with its own separate offset ('width/2+wob(1)*15' inside drawClock()), so the drips can drift out of alignment with where the clock body actually is on screen.

💡 Store the clock's current translate offset in a shared variable (or expose a getClockPosition() helper) and reuse it when computing where drops spawn, so the drips always appear to fall from the clock's actual current position.

STYLE entire file

The whole sketch is written with almost no whitespace, indentation, or line breaks between statements, which makes it very hard to read, debug, or extend.

💡 Reformat the code with consistent indentation, one statement per line, and blank lines between logical sections (e.g. inside drawClock() and updateDrops()) - this changes nothing visually but makes future edits much safer.

FEATURE draw() / global

All of the melting behavior, colors, and drip rate are hardcoded, so the viewer has no way to interact with the piece beyond watching it run.

💡 Add simple interactivity, such as mapping mouseX to the wobble intensity in wob(), or a keyPressed() handler that cycles through different color palettes, to make the surreal effect explorable rather than purely passive.

🔄 Code Flow

Code flow showing setup, wob, drawbg, hand, drawclock, updatedrops, draw, windowresized

💡 Click on function names in the diagram to jump to their code

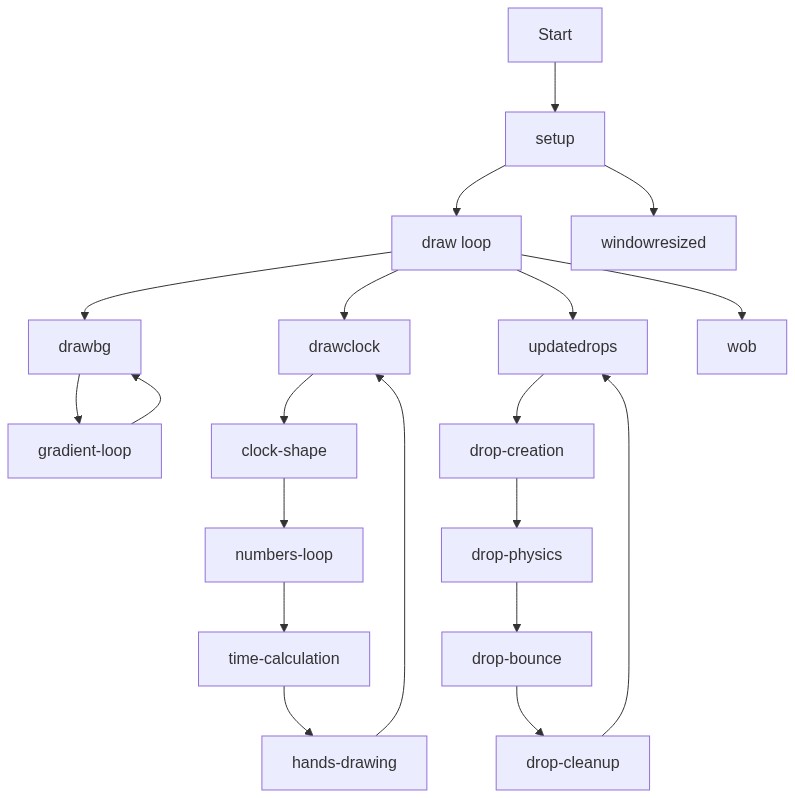
graph TD start[Start] --> setup[setup] setup --> draw[draw loop] draw --> drawbg[drawBg] draw --> updatedrops[updateDrops] draw --> drawclock[drawClock] drawbg --> rowloop[gradient-row-loop] rowloop --> drawbg drawclock --> tipcalc[tip-position-calc] drawclock --> controlcalc[control-point-calc] drawclock --> blob[blob-outline] drawclock --> numberloop[number-loop] drawclock --> timeangles[time-angles] updatedrops --> spawncheck[spawn-check] spawncheck -->|if true| updatedrops spawncheck -->|if false| dropupdate[drop-update-loop] dropupdate --> dropcleanup[drop-cleanup] dropcleanup --> updatedrops click setup href "#fn-setup" click draw href "#fn-draw" click drawbg href "#fn-drawbg" click updatedrops href "#fn-updatedrops" click drawclock href "#fn-drawclock" click rowloop href "#sub-gradient-row-loop" click tipcalc href "#sub-tip-position-calc" click controlcalc href "#sub-control-point-calc" click blob href "#sub-blob-outline" click numberloop href "#sub-number-loop" click timeangles href "#sub-time-angles" click spawncheck href "#sub-spawn-check" click dropupdate href "#sub-drop-update-loop" click dropcleanup href "#sub-drop-cleanup"

❓ Frequently Asked Questions

What visual experience does the AI Melting Clock sketch offer?

The AI Melting Clock sketch creates a surreal visual experience with a droopy clock face that wobbles and stretches, set against a warm sunset gradient that evokes a dreamlike atmosphere.

Is there any interaction available for users in this creative coding sketch?

The sketch is primarily a visual display without direct user interaction, allowing viewers to appreciate its artistic interpretation of time.

What creative coding concepts are showcased in the AI Melting Clock sketch?

This sketch demonstrates techniques like noise-based animation for smooth motion and bezier curves for organic shapes, embodying the principles of generative art.

Preview

AI Melting Clock - Dali-Inspired Surreal Time Display - p5.js creative coding sketch preview
Sketch Preview
Code flow diagram showing the structure of AI Melting Clock - Dali-Inspired Surreal Time Display - Code flow showing setup, wob, drawbg, hand, drawclock, updatedrops, draw, windowresized
Code Flow Diagram