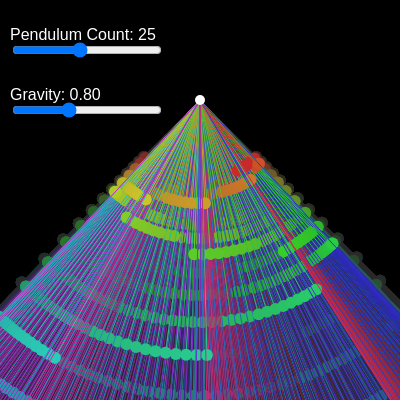
AI Pendulum Wave - Mesmerizing Physics Simulation Watch multiple pendulums of varying lengths swing

This sketch creates a mesmerizing pendulum wave simulation where multiple pendulums of varying lengths swing together, creating periodic patterns that fall in and out of phase. The visualization uses color gradients and trail effects to show the motion of each pendulum, with interactive sliders to control the number of pendulums and gravity strength.

πŸŽ“ Concepts You'll Learn

Physics simulationPendulum motionAngular acceleration and velocityDampingOffscreen graphics buffersColor gradientsInteractive slidersObject-oriented programming with classesCanvas resizingHSB color mode

πŸ”„ Code Flow

Code flow showing setup, initializependulums, draw, pendulum, windowresized

πŸ’‘ Click on function names in the diagram to jump to their code

graph TD start[Start] --> setup[setup] click setup href "#fn-setup" setup --> canvas-creation[Canvas and Color Mode Setup] click canvas-creation href "#sub-canvas-creation" setup --> trail-buffer-creation[Trail Graphics Buffer Setup] click trail-buffer-creation href "#sub-trail-buffer-creation" setup --> pendulum-count-slider[Pendulum Count Slider Creation] click pendulum-count-slider href "#sub-pendulum-count-slider" setup --> gravity-slider[Gravity Slider Creation] click gravity-slider href "#sub-gravity-slider" setup --> initializependulums[initializependulums] click initializependulums href "#fn-initializependulums" draw[draw loop] --> slider-change-detection[Pendulum Count Change Detection] click slider-change-detection href "#sub-slider-change-detection" draw --> gravity-update[Gravity Update from Slider] click gravity-update href "#sub-gravity-update" draw --> trail-fade[Trail Fading Effect] click trail-fade href "#sub-trail-fade" draw --> pendulum-update-loop[Pendulum Physics and Drawing Loop] click pendulum-update-loop href "#sub-pendulum-update-loop" pendulum-update-loop --> pendulum-creation-loop[Pendulum Creation Loop] click pendulum-creation-loop href "#sub-pendulum-creation-loop" pendulum-update-loop --> anchor-point[Anchor Point Calculation] click anchor-point href "#sub-anchor-point" pendulum-update-loop --> anchor-circle[Anchor Point Visualization] click anchor-circle href "#sub-anchor-circle" pendulum-update-loop --> constructor[Pendulum Constructor] click constructor href "#sub-constructor" constructor --> angular-acceleration[Angular Acceleration Calculation] click angular-acceleration href "#sub-angular-acceleration" angular-acceleration --> velocity-update[Angular Velocity Update] click velocity-update href "#sub-velocity-update" velocity-update --> damping-application[Damping Application] click damping-application href "#sub-damping-application" damping-application --> angle-update[Angle Update] click angle-update href "#sub-angle-update" pendulum-update-loop --> bob-position-calculation[Bob Position Calculation] click bob-position-calculation href "#sub-bob-position-calculation" bob-position-calculation --> rod-drawing[Rod Drawing] click rod-drawing href "#sub-rod-drawing" rod-drawing --> bob-drawing[Bob Drawing] click bob-drawing href "#sub-bob-drawing" draw --> display-trails[Display Trails to Canvas] click display-trails href "#sub-display-trails" windowresized[windowresized] --> canvas-resize[Canvas Resizing] click canvas-resize href "#sub-canvas-resize" windowresized --> trail-buffer-resize[Trail Buffer Resizing] click trail-buffer-resize href "#sub-trail-buffer-resize" windowresized --> pendulum-reinit[Pendulum Re-initialization] click pendulum-reinit href "#sub-pendulum-reinit"

πŸ“ Code Breakdown

setup()

setup() runs once when the sketch starts. It's where you initialize your canvas, create UI elements, and set up any data structures. The key concept here is creating an offscreen graphics buffer (trailGraphics) that allows us to draw trails that gradually fade out, creating the beautiful trailing effect you see in the animation.

function setup() {
  // Create the main canvas
  createCanvas(windowWidth, windowHeight);
  // Use HSB color mode for easy gradient generation
  colorMode(HSB, 360, 100, 100, 100);

  // Create the offscreen graphics buffer for trails
  trailGraphics = createGraphics(windowWidth, windowHeight);
  trailGraphics.colorMode(HSB, 360, 100, 100, 100);
  // Fill the trail buffer with a dark background initially
  trailGraphics.background(0, 0, 0, 100);

  // --- Create Sliders ---

  // Pendulum Count Slider
  pendulumCountLabel = createP('Pendulum Count: ');
  pendulumCountLabel.position(10, 10);
  pendulumCountLabel.class('p5js_label'); // Add class for styling
  pendulumCountSlider = createSlider(5, 50, 25, 1); // Min 5, Max 50, Initial 25, Step 1
  pendulumCountSlider.position(10, 40);
  pendulumCountSlider.class('p5js_slider'); // Add class for styling
  // Re-initialize pendulums whenever the slider changes
  pendulumCountSlider.input(initializePendulums);

  // Gravity Slider
  gravityLabel = createP('Gravity: ');
  gravityLabel.position(10, 70);
  gravityLabel.class('p5js_label'); // Add class for styling
  gravitySlider = createSlider(0.1, 2, g, 0.01); // Min 0.1, Max 2, Initial g, Step 0.01
  gravitySlider.position(10, 100);
  gravitySlider.class('p5js_slider'); // Add class for styling

  // Set the initial pendulum count and initialize them
  currentPendulumCount = pendulumCountSlider.value();
  initializePendulums();
}

πŸ”§ Subcomponents:

calculation Canvas and Color Mode Setup createCanvas(windowWidth, windowHeight); colorMode(HSB, 360, 100, 100, 100);

Creates a full-window canvas and switches to HSB color mode for easier color gradients

calculation Trail Graphics Buffer Setup trailGraphics = createGraphics(windowWidth, windowHeight); trailGraphics.colorMode(HSB, 360, 100, 100, 100); trailGraphics.background(0, 0, 0, 100);

Creates an offscreen graphics buffer to accumulate and display pendulum trails

calculation Pendulum Count Slider Creation pendulumCountSlider = createSlider(5, 50, 25, 1); pendulumCountSlider.input(initializePendulums);

Creates an interactive slider to control the number of pendulums (5-50) and triggers re-initialization when changed

calculation Gravity Slider Creation gravitySlider = createSlider(0.1, 2, g, 0.01);

Creates an interactive slider to control gravity strength from 0.1 to 2

Line by Line:

createCanvas(windowWidth, windowHeight);
Creates a canvas that fills the entire browser window, making the visualization responsive
colorMode(HSB, 360, 100, 100, 100);
Switches to HSB (Hue, Saturation, Brightness) color mode with ranges 0-360 for hue, 0-100 for saturation and brightness, and 0-100 for alpha. This makes it easy to create smooth color gradients
trailGraphics = createGraphics(windowWidth, windowHeight);
Creates an offscreen graphics buffer (invisible drawing surface) the same size as the canvas to accumulate pendulum trails
trailGraphics.colorMode(HSB, 360, 100, 100, 100);
Sets the trail graphics buffer to use the same HSB color mode as the main canvas
trailGraphics.background(0, 0, 0, 100);
Fills the trail buffer with a dark background (black with some transparency) to prepare it for drawing
pendulumCountLabel = createP('Pendulum Count: ');
Creates a text label above the pendulum count slider
pendulumCountSlider = createSlider(5, 50, 25, 1);
Creates a slider with minimum 5 pendulums, maximum 50, starting at 25, incrementing by 1
pendulumCountSlider.input(initializePendulums);
Connects the slider so that whenever its value changes, the initializePendulums() function is called automatically
gravitySlider = createSlider(0.1, 2, g, 0.01);
Creates a slider with minimum gravity 0.1, maximum 2, starting at the current g value, incrementing by 0.01
currentPendulumCount = pendulumCountSlider.value();
Reads the initial slider value and stores it to track when the user changes it
initializePendulums();
Calls the initialization function to create the first set of pendulums based on the slider values

initializePendulums()

This function is the heart of the pendulum wave effect. The key insight is the length formula: L_i = L_shortest * (N / (N - i))^2. This mathematical relationship ensures that if all pendulums start at the same angle, they will periodically synchronize again. For example, with 25 pendulums, they might all align every 10 seconds, creating a wave-like visual effect. The function is called both in setup() and whenever the slider changes, allowing dynamic adjustment.

function initializePendulums() {
  pendulums = []; // Clear existing pendulums
  currentPendulumCount = pendulumCountSlider.value();
  // Update the label to show the current pendulum count
  pendulumCountLabel.html('Pendulum Count: ' + currentPendulumCount);

  // Clear trails on the offscreen buffer when pendulums are re-initialized
  trailGraphics.background(0, 0, 0, 100);

  // Anchor point for all pendulums (top center of the canvas)
  let cx = width / 2;
  let cy = height / 4;

  // Pendulum wave formula: L_i = L_shortest * (N / (N - i))^2
  // This formula ensures that all pendulums complete an integer number of cycles
  // in the same total time, causing them to periodically fall in and out of phase.
  // 'i' goes from 0 to N-1, where i=0 is the shortest pendulum.
  for (let i = 0; i < currentPendulumCount; i++) {
    let N = currentPendulumCount;
    let L = L_shortest * pow(N / (N - i), 2);
    // Create a new Pendulum object and add it to the array
    pendulums.push(new Pendulum(L, g, damping, cx, cy, i, N));
  }
}

πŸ”§ Subcomponents:

calculation Clear and Reset pendulums = []; currentPendulumCount = pendulumCountSlider.value(); pendulumCountLabel.html('Pendulum Count: ' + currentPendulumCount);

Empties the pendulum array and updates the display label with the new count

calculation Trail Buffer Reset trailGraphics.background(0, 0, 0, 100);

Clears all accumulated trails from the graphics buffer when pendulums are re-initialized

calculation Anchor Point Calculation let cx = width / 2; let cy = height / 4;

Sets the pivot point where all pendulums are anchored (top-center of canvas)

for-loop Pendulum Creation Loop for (let i = 0; i < currentPendulumCount; i++) { let N = currentPendulumCount; let L = L_shortest * pow(N / (N - i), 2); pendulums.push(new Pendulum(L, g, damping, cx, cy, i, N)); }

Creates each pendulum with a calculated length using the pendulum wave formula, ensuring they fall in and out of phase

Line by Line:

pendulums = [];
Clears the pendulum array by creating a new empty array, removing all old pendulum objects
currentPendulumCount = pendulumCountSlider.value();
Reads the current slider value and stores it in the tracking variable
pendulumCountLabel.html('Pendulum Count: ' + currentPendulumCount);
Updates the label text to display the current number of pendulums
trailGraphics.background(0, 0, 0, 100);
Clears all trails from the offscreen graphics buffer by filling it with a dark background
let cx = width / 2;
Sets the anchor x-coordinate to the horizontal center of the canvas
let cy = height / 4;
Sets the anchor y-coordinate to one-quarter down from the top of the canvas
for (let i = 0; i < currentPendulumCount; i++) {
Loops from 0 to the number of pendulums minus 1, creating each pendulum one at a time
let N = currentPendulumCount;
Stores the total number of pendulums in a variable N for use in the length formula
let L = L_shortest * pow(N / (N - i), 2);
Calculates the length of this pendulum using the pendulum wave formula. Each pendulum gets progressively longer, ensuring they complete different numbers of cycles in the same time
pendulums.push(new Pendulum(L, g, damping, cx, cy, i, N));
Creates a new Pendulum object with the calculated length and adds it to the pendulums array

draw()

draw() runs 60 times per second, creating the animation. Each frame, it: (1) reads slider values, (2) checks for user input, (3) updates the trail buffer with a transparent overlay to create fading, (4) updates and draws each pendulum, and (5) displays the accumulated trails. The key to the visual effect is the trail bufferβ€”by drawing a nearly transparent rectangle over it each frame, old trails gradually fade out while new ones appear, creating the mesmerizing effect.

function draw() {
  // Update gravity from the slider
  g = gravitySlider.value();
  // Update the label to show the current gravity value
  gravityLabel.html('Gravity: ' + g.toFixed(2));

  // Check if the pendulum count slider value has changed.
  // If it has, re-initialize the pendulums.
  if (pendulumCountSlider.value() !== currentPendulumCount) {
    initializePendulums();
  }

  // --- Trail Drawing ---
  // Draw a very transparent black rectangle over the trail buffer.
  // This makes existing trails gradually fade out, creating the trailing effect.
  trailGraphics.noStroke();
  trailGraphics.fill(0, 0, 0, 1); // Low alpha value for long trails
  trailGraphics.rect(0, 0, width, height);

  // --- Pendulum Simulation and Drawing ---
  // Loop through each pendulum, update its physics, and draw it
  for (let p of pendulums) {
    p.update(g); // Update pendulum's position based on physics and current gravity
    p.display(trailGraphics); // Draw the pendulum on the trail graphics buffer
  }

  // Display the accumulated trails from the offscreen buffer onto the main canvas
  image(trailGraphics, 0, 0);

  // Draw a small circle at the anchor point of the pendulums
  noStroke();
  fill(360, 0, 100); // White color
  circle(width / 2, height / 4, 10); // Diameter 10
}

πŸ”§ Subcomponents:

calculation Gravity Update from Slider g = gravitySlider.value(); gravityLabel.html('Gravity: ' + g.toFixed(2));

Reads the gravity slider value and updates the label to show the current gravity

conditional Pendulum Count Change Detection if (pendulumCountSlider.value() !== currentPendulumCount) { initializePendulums(); }

Checks if the user moved the pendulum count slider and re-initializes if it changed

calculation Trail Fading Effect trailGraphics.noStroke(); trailGraphics.fill(0, 0, 0, 1); trailGraphics.rect(0, 0, width, height);

Draws a very transparent dark rectangle over the trail buffer to gradually fade out old trails

for-loop Pendulum Physics and Drawing Loop for (let p of pendulums) { p.update(g); p.display(trailGraphics); }

Updates each pendulum's physics and draws it on the trail graphics buffer

calculation Display Trails to Canvas image(trailGraphics, 0, 0);

Copies the accumulated trails from the offscreen buffer to the main canvas

calculation Anchor Point Visualization noStroke(); fill(360, 0, 100); circle(width / 2, height / 4, 10);

Draws a white circle at the anchor point where all pendulums pivot

Line by Line:

g = gravitySlider.value();
Reads the current gravity value from the slider and stores it in the global g variable
gravityLabel.html('Gravity: ' + g.toFixed(2));
Updates the gravity label to display the current value rounded to 2 decimal places
if (pendulumCountSlider.value() !== currentPendulumCount) {
Checks if the pendulum count slider has changed by comparing its current value to the stored value
initializePendulums();
If the slider changed, calls initializePendulums() to create a new set of pendulums
trailGraphics.noStroke();
Removes the stroke (outline) for drawing on the trail graphics buffer
trailGraphics.fill(0, 0, 0, 1);
Sets the fill color to nearly black with very low alpha (1 out of 100), making it nearly transparent
trailGraphics.rect(0, 0, width, height);
Draws a transparent rectangle covering the entire trail buffer, which gradually fades out existing trails
for (let p of pendulums) {
Loops through each pendulum object in the pendulums array
p.update(g);
Calls the update method on the pendulum to calculate its new position based on physics and current gravity
p.display(trailGraphics);
Calls the display method on the pendulum to draw it on the trail graphics buffer
image(trailGraphics, 0, 0);
Copies the entire trail graphics buffer to the main canvas at position (0, 0), displaying all accumulated trails
fill(360, 0, 100);
Sets the fill color to white (hue 360, saturation 0, brightness 100 in HSB mode)
circle(width / 2, height / 4, 10);
Draws a white circle with diameter 10 at the anchor point to show where all pendulums pivot

Pendulum class

The Pendulum class encapsulates all the physics and drawing logic for a single pendulum. The physics uses the simple pendulum approximation: angular acceleration = -(g/L) * sin(ΞΈ). This is solved using Euler integration, which updates velocity and position each frame. The damping factor (0.9995) slightly reduces velocity each frame, preventing perpetual motion and creating realistic behavior. The color gradient (using map() to convert index to hue) creates the beautiful rainbow effect as pendulums swing.

class Pendulum {
  constructor(L, g, damping, cx, cy, index, totalPendulums) {
    this.L = L; // Length of the pendulum
    this.g = g; // Gravity
    this.damping = damping; // Damping factor
    this.cx = cx; // Anchor x-coordinate
    this.cy = cy; // Anchor y-coordinate

    this.theta = PI / 4; // Initial angle from vertical (45 degrees)
    this.omega = 0; // Initial angular velocity
    this.alpha = 0; // Initial angular acceleration

    // Assign a color based on its index in the array for a gradient effect
    this.color = color(map(index, 0, totalPendulums, 0, 360), 80, 80);
  }

  /**
   * Updates the pendulum's physics (angle, velocity, acceleration).
   * @param {number} newG The current gravity value from the slider.
   */
  update(newG) {
    this.g = newG; // Update gravity from the slider
    // Calculate angular acceleration
    this.alpha = (-this.g / this.L) * sin(this.theta);
    // Update angular velocity
    this.omega += this.alpha;
    // Update angle
    this.theta += this.omega;
    // Apply damping
    this.omega *= this.damping;
  }

  /**
   * Displays the pendulum (rod and bob) on the provided graphics buffer.
   * @param {p5.Graphics} graphics The graphics buffer to draw on.
   */
  display(graphics) {
    // Calculate the position of the pendulum bob
    let bobX = this.cx + this.L * sin(this.theta);
    let bobY = this.cy + this.L * cos(this.theta);

    // Draw the pendulum rod
    graphics.stroke(this.color); // Use the pendulum's assigned color
    graphics.strokeWeight(1);
    graphics.line(this.cx, this.cy, bobX, bobY);

    // Draw the pendulum bob
    graphics.noStroke();
    graphics.fill(this.color, 150); // Slightly more opaque color for the bob
    graphics.circle(bobX, bobY, 12); // Bob diameter 12
  }
}

πŸ”§ Subcomponents:

calculation Pendulum Constructor constructor(L, g, damping, cx, cy, index, totalPendulums) { this.L = L; this.g = g; this.damping = damping; this.cx = cx; this.cy = cy; this.theta = PI / 4; this.omega = 0; this.alpha = 0; this.color = color(map(index, 0, totalPendulums, 0, 360), 80, 80); }

Initializes a new pendulum with its physical properties, starting angle, and color based on its position in the array

calculation Angular Acceleration Calculation this.alpha = (-this.g / this.L) * sin(this.theta);

Calculates angular acceleration using the simple pendulum formula: Ξ± = -(g/L) * sin(ΞΈ)

calculation Angular Velocity Update this.omega += this.alpha;

Updates angular velocity by adding the acceleration (Euler integration)

calculation Angle Update this.theta += this.omega;

calculation Damping Application this.omega *= this.damping;

Reduces angular velocity by multiplying by the damping factor (0.9995), simulating air resistance

calculation Bob Position Calculation let bobX = this.cx + this.L * sin(this.theta); let bobY = this.cy + this.L * cos(this.theta);

Converts polar coordinates (angle and length) to Cartesian coordinates (x and y) for drawing

calculation Rod Drawing graphics.stroke(this.color); graphics.strokeWeight(1); graphics.line(this.cx, this.cy, bobX, bobY);

Draws a line from the anchor point to the bob position, representing the pendulum rod

calculation Bob Drawing graphics.noStroke(); graphics.fill(this.color, 150); graphics.circle(bobX, bobY, 12);

Draws a circle at the bob's position with the pendulum's color and diameter 12

Line by Line:

class Pendulum {
Defines a new class called Pendulum that will hold all the properties and methods for a single pendulum
constructor(L, g, damping, cx, cy, index, totalPendulums) {
The constructor method runs when a new Pendulum is created, taking parameters for length, gravity, damping, anchor position, and color information
this.L = L;
Stores the pendulum's length as a property of this object
this.theta = PI / 4;
Sets the initial angle to PI/4 radians (45 degrees from vertical), so all pendulums start at the same angle
this.omega = 0;
Initializes angular velocity to 0, meaning the pendulum starts from rest
this.color = color(map(index, 0, totalPendulums, 0, 360), 80, 80);
Creates a unique color for this pendulum by mapping its index to a hue value (0-360), creating a rainbow gradient across all pendulums
update(newG) {
Method that updates the pendulum's physics each frame
this.g = newG;
Updates the gravity value from the slider
this.alpha = (-this.g / this.L) * sin(this.theta);
Calculates angular acceleration using the simple pendulum equation. The negative sign means the acceleration opposes the displacement
this.omega += this.alpha;
Updates angular velocity by adding the acceleration (simple Euler integration method)
this.theta += this.omega;
Updates the angle by adding the angular velocity, moving the pendulum to its new position
this.omega *= this.damping;
Applies damping by multiplying velocity by 0.9995, gradually reducing oscillation to simulate air resistance
display(graphics) {
Method that draws the pendulum on the provided graphics buffer
let bobX = this.cx + this.L * sin(this.theta);
Calculates the x-coordinate of the bob using sine of the angle (horizontal displacement from anchor)
let bobY = this.cy + this.L * cos(this.theta);
Calculates the y-coordinate of the bob using cosine of the angle (vertical displacement from anchor)
graphics.line(this.cx, this.cy, bobX, bobY);
Draws a line from the anchor point to the bob position, representing the rigid rod
graphics.circle(bobX, bobY, 12);
Draws a circle at the bob's position with diameter 12 pixels

windowResized()

windowResized() is a special p5.js function that automatically runs whenever the user resizes their browser window. This is important for responsive design. Without this function, the canvas would stay the same size or become distorted. By resizing both the main canvas and the trail graphics buffer, and re-initializing the pendulums, we ensure the sketch adapts smoothly to any window size.

function windowResized() {
  resizeCanvas(windowWidth, windowHeight);
  trailGraphics.resizeCanvas(windowWidth, windowHeight);
  trailGraphics.background(0, 0, 0, 100); // Clear trails on resize
  initializePendulums(); // Re-initialize pendulums based on new canvas size
}

πŸ”§ Subcomponents:

calculation Canvas Resizing resizeCanvas(windowWidth, windowHeight);

Resizes the main canvas to match the new window dimensions

calculation Trail Buffer Resizing trailGraphics.resizeCanvas(windowWidth, windowHeight); trailGraphics.background(0, 0, 0, 100);

Resizes the offscreen trail graphics buffer and clears any accumulated trails

calculation Pendulum Re-initialization initializePendulums();

Re-initializes all pendulums with new anchor positions based on the resized canvas

Line by Line:

function windowResized() {
This special p5.js function is automatically called whenever the browser window is resized
resizeCanvas(windowWidth, windowHeight);
Resizes the main canvas to match the new window width and height
trailGraphics.resizeCanvas(windowWidth, windowHeight);
Resizes the offscreen graphics buffer to match the new canvas size
trailGraphics.background(0, 0, 0, 100);
Clears all accumulated trails from the graphics buffer by filling it with a dark background
initializePendulums();
Re-initializes all pendulums so their anchor point (cx, cy) is recalculated based on the new canvas dimensions

πŸ“¦ Key Variables

pendulums array

Stores all Pendulum objects. Each element is a Pendulum instance with its own physics and properties

let pendulums = [];
trailGraphics p5.Graphics

An offscreen graphics buffer where pendulum trails are drawn. This allows trails to accumulate and fade gradually

let trailGraphics = createGraphics(width, height);
g number

Gravity constant that affects how fast pendulums accelerate. Controlled by the gravity slider

let g = 0.8;
L_shortest number

The length of the shortest pendulum in pixels. Used as a base for calculating all other pendulum lengths

let L_shortest = 80;
damping number

A factor between 0 and 1 that reduces angular velocity each frame, simulating air resistance and preventing perpetual motion

let damping = 0.9995;
pendulumCountSlider p5.Slider

UI slider element that allows the user to control how many pendulums are displayed (5-50)

let pendulumCountSlider = createSlider(5, 50, 25, 1);
gravitySlider p5.Slider

UI slider element that allows the user to control gravity strength (0.1-2)

let gravitySlider = createSlider(0.1, 2, 0.8, 0.01);
pendulumCountLabel p5.Renderer

HTML text element that displays the current number of pendulums

let pendulumCountLabel = createP('Pendulum Count: ');
gravityLabel p5.Renderer

HTML text element that displays the current gravity value

let gravityLabel = createP('Gravity: ');
currentPendulumCount number

Tracks the last known value of the pendulum count slider to detect when the user changes it

let currentPendulumCount = 0;

πŸ§ͺ Try This!

Experiment with the code by making these changes:

  1. Change L_shortest from 80 to 120 on line 8. This makes the shortest pendulum longer, which will slow down all pendulums proportionally. Watch how the wave pattern changes!
  2. Modify the damping value from 0.9995 to 0.99 on line 9. This increases air resistance. The pendulums will lose energy faster and eventually stop swinging. Try 0.999 for a middle ground.
  3. In the initializePendulums() function, change the anchor point from 'height / 4' to 'height / 2' on line 50. This moves the pivot point to the middle of the canvas vertically.
  4. In the Pendulum constructor, change the initial angle from 'PI / 4' to 'PI / 2' on line 119. This makes all pendulums start horizontally instead of at 45 degrees.
  5. Modify the bob diameter from 12 to 20 on line 141. This makes the pendulum bobs larger and more visible.
  6. In the draw() function, change the trail fade transparency from 1 to 5 on line 85. Higher values make trails fade out faster, creating shorter trails.
  7. Change the gravity slider range from (0.1, 2) to (0.1, 5) on line 40. This allows you to explore much stronger gravity effects.
  8. In the Pendulum display() method, change the rod strokeWeight from 1 to 2 on line 136. This makes the pendulum rods thicker and more visible.
Open in Editor & Experiment β†’

πŸ”§ Potential Improvements

Here are some ways this code could be enhanced:

PERFORMANCE draw() function, trail fading loop

Drawing a transparent rectangle over the entire trail graphics buffer every frame is computationally expensive, especially on large monitors

πŸ’‘ Consider using a lower alpha value (like 0.5 instead of 1) to fade trails faster, or implement a frame skip where the fade only happens every 2-3 frames instead of every frame

BUG initializePendulums() function, pendulum length calculation

When i equals N-1 (the last pendulum), the formula becomes L_shortest * (N / 1)^2, which creates an extremely long pendulum. For 50 pendulums, this would be 50^2 = 2500 times longer than the shortest, potentially going off-screen

πŸ’‘ Add a constraint to limit maximum pendulum length: let L = constrain(L_shortest * pow(N / (N - i), 2), L_shortest, windowHeight * 0.3);

STYLE Pendulum class, constructor

The color assignment uses map() to create a hue gradient, but with many pendulums, adjacent colors can be very similar. The saturation and brightness are fixed at 80, which may not provide enough visual contrast

πŸ’‘ Consider varying saturation or brightness based on pendulum length to create more visual distinction: this.color = color(map(index, 0, totalPendulums, 0, 360), map(index, 0, totalPendulums, 50, 100), 80);

FEATURE UI controls

There's no way to pause/resume the animation or reset the pendulums to their initial state

πŸ’‘ Add buttons for pause/resume and reset functionality. For example: let pauseButton = createButton('Pause'); pauseButton.mousePressed(() => { paused = !paused; });

BUG windowResized() function

When the window is resized, the pendulum anchor point changes, which can cause a sudden visual jump in the pendulum positions

πŸ’‘ Store the current angles and velocities before re-initializing, then restore them after: let savedAngles = pendulums.map(p => p.theta); initializePendulums(); pendulums.forEach((p, i) => { p.theta = savedAngles[i]; });

PERFORMANCE draw() function, slider value checking

Comparing pendulumCountSlider.value() to currentPendulumCount every frame is unnecessary since the slider has an input event listener

πŸ’‘ Remove the if-check in draw() since initializePendulums() is already called by pendulumCountSlider.input(). This eliminates an unnecessary comparison every frame

Preview

AI Pendulum Wave - Mesmerizing Physics Simulation Watch multiple pendulums of varying lengths swing - p5.js creative coding sketch preview
Sketch Preview
Code flow diagram showing the structure of AI Pendulum Wave - Mesmerizing Physics Simulation Watch multiple pendulums of varying lengths swing - Code flow showing setup, initializependulums, draw, pendulum, windowresized
Code Flow Diagram