
AI Reaction Time Test - Speed Challenge Game Test your reflexes! Wait for the circle to turn green,

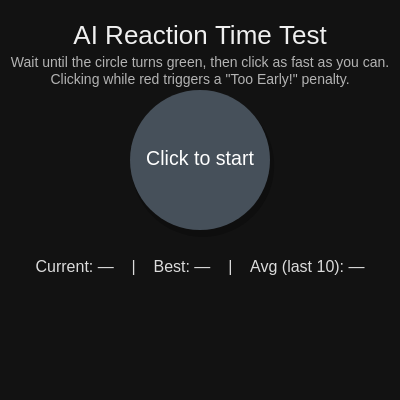
This sketch is a reaction-time testing game: a circle sits in the middle of the screen and cycles through red (wait), green (click now!), yellow (clicked too early), and a result screen showing your reaction time in milliseconds. It tracks your best time, a rolling average of your last 10 attempts, and renders them as a live bar chart at the bottom of the screen.

🧪 Try This!

Experiment with the code by making these changes:

  1. Slow down the wait time — Widen the random delay range so you wait longer in suspense before the circle turns green.
  2. Make the circle huge — Increase the multiplier controlling the circle's diameter so the target fills much more of the screen.
  3. Turn the penalty alarming red — Swap the mellow yellow too-early color for a more jarring bright red to make mistakes feel more dramatic.
Prefer the full editor? Open it there →

📖 About This Sketch

This sketch builds a full reaction-time testing game out of a single animated circle. The circle shifts through five colored states - idle gray, waiting red, success green, penalty yellow, and a results screen - driven entirely by a state machine stored in one string variable. Under the hood it leans on millis() for precise timing, random() to pick an unpredictable delay, and a growing array plus map() to turn your recent scores into a live bar chart.

The code is organized around a simple state variable (`state`) that draw() reads every frame to decide what color and text to show, while a handful of helper functions each own one visual piece: drawHeader() for the title, drawStats() for the number readout, and drawChart() for the bar graph. By studying it you'll learn how to build a finite-state machine in p5.js, how to time human input with millis(), and how to visualize an array of numbers as bars using map().

⚙️ How It Works

  1. When the page loads, setup() creates a canvas that fills the browser window and sets a sans-serif font; the game starts in the 'idle' state showing a gray circle with a 'Click to start' label.
  2. Every frame, draw() picks a fill color based on the current state, draws a soft drop-shadow and the main circle, then calls handleStateTimers(), drawCircleLabel(), drawHeader(), drawStats(), and drawChart() to layer the text and chart on top.
  3. Clicking the circle while idle calls startWaitingState(), which sets state to 'waiting' and schedules a random delay (1-5 seconds) after which the circle should turn green.
  4. handleStateTimers() checks millis() every frame; once the random delay has passed it flips the state to 'green' and records the exact moment via greenStartTime.
  5. mousePressed() reacts differently depending on state: clicking too early during red triggers the yellow 'too-early' penalty, while clicking during green computes your reaction time (millis() - greenStartTime), stores it in the attempts array, updates your best time, and moves to 'show-result'.
  6. Both the too-early and show-result states auto-advance back to a new waiting round after 1.5 seconds via handleStateTimers(), and drawChart() continuously re-renders the last 10 attempts as bars, highlighting your fastest time in green.

🎓 Concepts You'll Learn

Finite state machinesmillis() timingRandom delaysArray-based data trackingmap() for data visualizationConditional renderingEvent-driven input (mousePressed)

📝 Code Breakdown

setup()

setup() runs exactly once when the sketch starts. It's the right place to configure things that don't change afterward, like canvas size and fonts.

function setup() {
  // Full-window canvas: https://p5js.org/reference/#/p5/createCanvas
  createCanvas(windowWidth, windowHeight);
  textFont('sans-serif');
}
Line-by-line explanation (2 lines)
createCanvas(windowWidth, windowHeight);
Creates a canvas that exactly matches the browser window's current width and height, so the game fills the whole screen.
textFont('sans-serif');
Sets the default font for all text() calls in the sketch to a clean sans-serif typeface.
draw()

draw() runs continuously at roughly 60 frames per second. This sketch uses it as the 'render' layer of a state machine: it never changes game logic itself, only reads the current `state` and calls small helper functions to paint the right visuals.

🔬 This chain picks the circle's color for every possible state. What happens if you change the 'waiting' color from red to something like color(120, 0, 200) (purple)? Does it change how urgent the game feels?

  if (state === 'idle') {
    circleCol = color(70, 80, 90);
  } else if (state === 'waiting') {
    circleCol = color(230, 76, 101); // red
  } else if (state === 'green' || state === 'show-result') {
    circleCol = color(46, 204, 113); // green
  } else if (state === 'too-early') {
    circleCol = color(241, 196, 15); // yellow
  }

🔬 This threshold decides when the chart is 'tall enough' to draw. What happens if you raise 80 to 300 on a normal-sized window - does the chart disappear?

  if (chartHeight > 80) {
    drawChart(chartMargin, chartTop, width - chartMargin * 2, chartHeight);
  }
function draw() {
  background(18); // dark modern background

  const centerX = width / 2;
  const centerY = height * 0.4;
  const circleDiameter = min(width, height) * 0.35;

  // Determine circle color based on state
  let circleCol;
  if (state === 'idle') {
    circleCol = color(70, 80, 90);
  } else if (state === 'waiting') {
    circleCol = color(230, 76, 101); // red
  } else if (state === 'green' || state === 'show-result') {
    circleCol = color(46, 204, 113); // green
  } else if (state === 'too-early') {
    circleCol = color(241, 196, 15); // yellow
  }

  // Subtle shadow behind circle
  noStroke();
  fill(0, 0, 0, 60);
  circle(centerX + circleDiameter * 0.02, centerY + circleDiameter * 0.04, circleDiameter * 1.02);

  // Main circle
  fill(circleCol);
  circle(centerX, centerY, circleDiameter); // https://p5js.org/reference/#/p5/circle

  // Handle timed state transitions
  handleStateTimers();

  // Text inside circle
  drawCircleLabel(centerX, centerY, circleDiameter);

  // Title & instructions at top
  drawHeader();

  // Stats below circle
  const statsY = centerY + circleDiameter / 2 + 30;
  drawStats(statsY);

  // Bar chart of last 10 attempts at bottom
  const chartMargin = 60;
  const chartTop = statsY + 40;
  const chartHeight = height - chartTop - chartMargin;

  if (chartHeight > 80) {
    drawChart(chartMargin, chartTop, width - chartMargin * 2, chartHeight);
  }
}
Line-by-line explanation (7 lines)

🔧 Subcomponents:

conditional Circle Color State Machine if (state === 'idle') {

Chooses which color to fill the circle with based on the current game state (idle, waiting, green, too-early).

calculation Drop Shadow circle(centerX + circleDiameter * 0.02, centerY + circleDiameter * 0.04, circleDiameter * 1.02);

Draws a slightly offset, semi-transparent black circle behind the main circle to fake a soft drop shadow.

conditional Chart Visibility Check if (chartHeight > 80) {

Only draws the bar chart when there's enough vertical space left on screen, preventing a squished or broken-looking chart on small windows.

background(18); // dark modern background
Clears the entire canvas to a near-black color every frame so nothing from the previous frame lingers.
const centerX = width / 2;
Calculates the horizontal center of the canvas so the circle stays centered even if the window resizes.
const centerY = height * 0.4;
Places the circle a bit above vertical center (40% down) to leave room for the header and chart below.
let circleCol;
Declares an empty variable that will be assigned a color() value depending on the state, then used to fill the circle.
fill(circleCol);
Applies whichever color was chosen above to the next shape drawn - in this case, the main circle.
handleStateTimers();
Calls the helper function that checks the clock and automatically advances the game between states.
if (chartHeight > 80) {
Skips drawing the chart entirely if the remaining space is too small, avoiding a cramped or broken layout.

handleStateTimers()

This function is the 'clock' of the state machine - it's called every frame from draw() but only acts when enough real time has passed, using millis() timestamps instead of frame counts so timing stays accurate regardless of frame rate.

🔬 This pauses the game for 1500ms after a premature click. What happens if you drop it to 500? Does the penalty feel less punishing?

  if (state === 'too-early' && now - tooEarlyStart > 1500) {
    // After showing "Too Early!" for 1.5s, start a new trial
    startWaitingState();
  }
function handleStateTimers() {
  const now = millis(); // https://p5js.org/reference/#/p5/millis

  if (state === 'waiting' && now >= targetChangeTime) {
    // Time to turn green
    state = 'green';
    greenStartTime = now;
  }

  if (state === 'too-early' && now - tooEarlyStart > 1500) {
    // After showing "Too Early!" for 1.5s, start a new trial
    startWaitingState();
  }

  if (state === 'show-result' && now - resultStart > 1500) {
    // After showing result for 1.5s, start a new trial
    startWaitingState();
  }
}
Line-by-line explanation (5 lines)

🔧 Subcomponents:

conditional Red-to-Green Transition if (state === 'waiting' && now >= targetChangeTime) {

Flips the state to 'green' the instant the randomly chosen delay time has elapsed, and records the exact moment for measuring reaction time.

conditional Too-Early Auto-Advance if (state === 'too-early' && now - tooEarlyStart > 1500) {

Automatically starts a new round 1.5 seconds after a premature click, without requiring any input.

conditional Result Auto-Advance if (state === 'show-result' && now - resultStart > 1500) {

Automatically starts a new round 1.5 seconds after showing your reaction time result.

const now = millis(); // https://p5js.org/reference/#/p5/millis
Grabs the current time in milliseconds since the sketch started, used to compare against saved timestamps.
if (state === 'waiting' && now >= targetChangeTime) {
Checks whether enough time has passed to turn the circle green - only runs this check while in the 'waiting' state.
greenStartTime = now;
Records the exact moment the circle turned green so the reaction time can later be calculated as millis() minus this value.
if (state === 'too-early' && now - tooEarlyStart > 1500) {
Checks if 1.5 seconds have passed since the too-early penalty started showing.
if (state === 'show-result' && now - resultStart > 1500) {
Checks if 1.5 seconds have passed since the result screen appeared, then moves on to the next round.

drawCircleLabel()

This function shows how a single piece of state can drive multiple pieces of UI at once - the same `state` variable controls both the circle's color in draw() and its text label here, keeping the two in sync automatically.

🔬 The label's size is 14% of the circle's diameter. What happens if you bump the multiplier up to 0.25 - does the text overflow the circle?

  textAlign(CENTER, CENTER);
  textSize(d * 0.14);
function drawCircleLabel(cx, cy, d) {
  fill(255);
  noStroke();
  textAlign(CENTER, CENTER);
  textSize(d * 0.14);

  let label = '';

  if (state === 'idle') {
    label = 'Click to start';
  } else if (state === 'waiting') {
    label = 'Wait for GREEN';
  } else if (state === 'green') {
    label = 'CLICK!';
  } else if (state === 'too-early') {
    label = 'Too early!';
  } else if (state === 'show-result') {
    // Show measured reaction time in the circle
    if (lastReactionTime != null) {
      label = nf(floor(lastReactionTime), 1) + ' ms';
    }
  }

  text(label, cx, cy);
}
Line-by-line explanation (4 lines)

🔧 Subcomponents:

conditional Label Text Chooser if (state === 'idle') {

Picks which instructional word or phrase to display inside the circle for the current state.

textAlign(CENTER, CENTER);
Makes text() draw its text centered both horizontally and vertically around the given (x, y) point - perfect for text inside a circle.
textSize(d * 0.14);
Scales the label's font size relative to the circle's diameter (d), so text stays proportional if the circle changes size.
label = nf(floor(lastReactionTime), 1) + ' ms';
Rounds the reaction time down to a whole number with floor(), formats it as a string with nf(), and appends ' ms' to build the result label.
text(label, cx, cy);
Draws whichever label string was chosen, centered at the circle's middle point.

drawHeader()

text() in p5.js can render multi-line strings if you include \n characters, which is how this function fits two sentences of instructions into one text() call instead of two.

function drawHeader() {
  fill(240);
  textAlign(CENTER, TOP);
  textSize(26);
  text('AI Reaction Time Test', width / 2, 24);

  textSize(14);
  fill(180);
  let instruction =
    'Wait until the circle turns green, then click as fast as you can.\n' +
    'Clicking while red triggers a "Too Early!" penalty.';
  text(instruction, width / 2, 56);
}
Line-by-line explanation (4 lines)
textAlign(CENTER, TOP);
Aligns text horizontally centered and anchored from its top edge, which is useful for stacking title and subtitle text neatly.
text('AI Reaction Time Test', width / 2, 24);
Draws the game's title centered horizontally, 24 pixels from the top of the canvas.
let instruction = 'Wait until the circle turns green, then click as fast as you can.\n' + 'Clicking while red triggers a "Too Early!" penalty.';
Builds a two-line instruction string using \n to force a line break when it's drawn.
text(instruction, width / 2, 56);
Draws the multi-line instructions below the title, also centered horizontally.

drawStats()

Template literals (the backtick strings with ${...}) let you embed variables directly inside text, which is much easier to read than concatenating strings with '+' repeatedly.

function drawStats(y) {
  const avg10 = getAverageLastN(10);

  const currentStr =
    lastReactionTime != null ? floor(lastReactionTime) + ' ms' : '—';
  const bestStr =
    bestTime != null ? floor(bestTime) + ' ms' : '—';
  const avgStr =
    avg10 != null ? floor(avg10) + ' ms' : '—';

  textAlign(CENTER, TOP);
  textSize(16);
  fill(220);
  text(
    `Current: ${currentStr}    |    Best: ${bestStr}    |    Avg (last 10): ${avgStr}`,
    width / 2,
    y
  );
}
Line-by-line explanation (3 lines)

🔧 Subcomponents:

calculation Null-Safe Formatting lastReactionTime != null ? floor(lastReactionTime) + ' ms' : '—';

Uses a ternary operator to show an em-dash placeholder instead of crashing or showing 'null' before any reaction time exists.

const avg10 = getAverageLastN(10);
Calls the helper function to compute the average of the last 10 valid reaction times.
lastReactionTime != null ? floor(lastReactionTime) + ' ms' : '—';
If a reaction time exists, formats it as a whole number with 'ms'; otherwise falls back to a dash placeholder for a cleaner first-run display.
text( `Current: ${currentStr} | Best: ${bestStr} | Avg (last 10): ${avgStr}`, width / 2, y );
Uses a template literal (backtick string) to combine three stats into one readable line and draws it centered at the given y position.

drawChart()

map() is one of the most useful functions in p5.js for data visualization - it rescales a number from one range (like 0-maxTime milliseconds) into another range (like 0-h pixels), which is exactly how raw data becomes a bar chart.

🔬 This highlights only the single best time in green. What happens if you change the comparison to highlight times below a fixed threshold, like t < 250, instead of only the very best one?

    if (t === minInData) {
      fill(46, 204, 113);
    } else {
      fill(52, 152, 219);
    }
function drawChart(x, y, w, h) {
  const data = attempts.slice(-10);
  if (data.length === 0) return;

  // Determine vertical scale
  const maxInData = max(data); // https://p5js.org/reference/#/p5/max
  const maxTime = max(maxInData, 300); // at least 300ms for stability
  const minInData = min(data); // used to highlight best

  // Chart frame
  stroke(70);
  noFill();
  rect(x, y, w, h, 8);

  const barCount = data.length;
  const slotWidth = w / barCount;
  const barWidth = slotWidth * 0.6;
  const gap = slotWidth * 0.4;

  for (let i = 0; i < barCount; i++) {
    const t = data[i];
    const barHeight = map(t, 0, maxTime, 0, h); // https://p5js.org/reference/#/p5/map
    const bx = x + i * slotWidth + gap / 2;
    const by = y + h - barHeight;

    noStroke();
    // Highlight the best (lowest) time in green, others blue
    if (t === minInData) {
      fill(46, 204, 113);
    } else {
      fill(52, 152, 219);
    }

    rect(bx, by, barWidth, barHeight, 4);

    // Numeric label above each bar
    fill(220);
    textAlign(CENTER, BOTTOM);
    textSize(12);
    text(floor(t), bx + barWidth / 2, by - 4);
  }

  // Axis label
  fill(180);
  textAlign(LEFT, BOTTOM);
  textSize(14);
  text('Last 10 reaction times (ms)', x, y - 8);
}
Line-by-line explanation (6 lines)

🔧 Subcomponents:

for-loop Bar Drawing Loop for (let i = 0; i < barCount; i++) {

Iterates over each of the last 10 reaction times, converting each value into a positioned, sized bar using map().

conditional Best Time Highlight if (t === minInData) {

Colors the bar representing the fastest reaction time green instead of blue, so the best score stands out visually.

const data = attempts.slice(-10);
Grabs only the most recent 10 entries from the attempts array (slice(-10) takes the last 10 items).
const maxTime = max(maxInData, 300); // at least 300ms for stability
Ensures the chart's vertical scale never goes below 300ms, so a handful of very fast attempts doesn't make the bars look artificially maxed out.
const slotWidth = w / barCount;
Divides the chart's total width evenly among however many bars are currently shown (up to 10).
const barHeight = map(t, 0, maxTime, 0, h); // https://p5js.org/reference/#/p5/map
Converts a reaction time in milliseconds into a pixel height, scaling proportionally between 0ms (0 pixels tall) and maxTime (full chart height).
if (t === minInData) {
Checks if this particular bar's time matches the fastest time in the current dataset, so it can be colored differently.
text(floor(t), bx + barWidth / 2, by - 4);
Draws the exact millisecond value just above each bar, rounded down to a whole number.

getAverageLastN()

reduce() is a powerful array method for turning a list of numbers into a single value (a sum, average, max, etc.) without writing a manual for-loop - it's worth learning alongside p5.js's own array-friendly functions like max() and min().

function getAverageLastN(n) {
  const data = attempts.slice(-n);
  if (data.length === 0) return null;
  const sum = data.reduce((acc, v) => acc + v, 0);
  return sum / data.length;
}
Line-by-line explanation (4 lines)

🔧 Subcomponents:

calculation Array Sum via Reduce const sum = data.reduce((acc, v) => acc + v, 0);

Adds up every value in the data array into a single total, starting the accumulator at 0.

const data = attempts.slice(-n);
Takes the last n entries from the attempts array (e.g. the last 10) without modifying the original array.
if (data.length === 0) return null;
Guards against dividing by zero - if there's no data yet, returns null instead of NaN.
const sum = data.reduce((acc, v) => acc + v, 0);
Uses Array.reduce() to add every number in the array together, building up the running total in `acc` starting from 0.
return sum / data.length;
Divides the total by how many values were summed to produce the average.

startWaitingState()

This function is the 'reset button' for each round - it's called both when the player first clicks to start, and automatically after a too-early penalty or a completed round, which keeps the game flowing without duplicating logic.

🔬 The random delay makes each round unpredictable. What happens if you replace random(1000, 5000) with a fixed value like 2000 - does the game become easier since you can anticipate the timing?

  state = 'waiting';
  const delayMs = random(1000, 5000); // https://p5js.org/reference/#/p5/random
  targetChangeTime = millis() + delayMs;
function startWaitingState() {
  state = 'waiting';
  const delayMs = random(1000, 5000); // https://p5js.org/reference/#/p5/random
  targetChangeTime = millis() + delayMs;
  greenStartTime = null;
}
Line-by-line explanation (4 lines)
state = 'waiting';
Switches the game into the 'waiting' state, which draw() will render as a red circle.
const delayMs = random(1000, 5000); // https://p5js.org/reference/#/p5/random
Picks a random wait time between 1 and 5 seconds so players can't predict exactly when green will appear.
targetChangeTime = millis() + delayMs;
Calculates the future timestamp (current time plus the random delay) at which the circle should turn green.
greenStartTime = null;
Resets the 'green appeared at' timestamp so a stale value from a previous round can't be accidentally reused.

mousePressed()

mousePressed() is a p5.js event function that runs automatically whenever the mouse is clicked - it's the primary way this sketch takes player input, and it demonstrates how the same event can mean different things depending on the current application state.

🔬 This keeps at most 100 stored attempts. What happens visually if you lower the cap to 3 - does the chart (which only shows the last 10 anyway) look any different, or does something else change?

    attempts.push(rt);
    if (attempts.length > 100) {
      attempts.shift(); // avoid unbounded growth
    }
function mousePressed() {
  if (state === 'idle') {
    // First click starts the test
    startWaitingState();
  } else if (state === 'waiting') {
    // Clicked too early during red
    state = 'too-early';
    tooEarlyStart = millis();
  } else if (state === 'green') {
    // Valid reaction
    const rt = millis() - greenStartTime;
    lastReactionTime = rt;

    attempts.push(rt);
    if (attempts.length > 100) {
      attempts.shift(); // avoid unbounded growth
    }

    if (bestTime === null || rt < bestTime) {
      bestTime = rt;
    }

    state = 'show-result';
    resultStart = millis();
  }

  // Ignore clicks in 'too-early' and 'show-result' states;
  // they auto-advance after a short delay.
}
Line-by-line explanation (6 lines)

🔧 Subcomponents:

conditional Click Response by State if (state === 'idle') {

Decides how a mouse click should be interpreted depending on what state the game is currently in - start, penalty, or scored reaction.

conditional Attempts Array Cap if (attempts.length > 100) {

Removes the oldest stored attempt once the array grows past 100 entries, preventing it from growing forever during a long play session.

if (state === 'idle') {
If the game hasn't started yet, treat this click as the signal to begin the first round.
state = 'too-early';
If the player clicked during the red 'waiting' phase, switch to the penalty state instead of scoring a reaction.
const rt = millis() - greenStartTime;
Calculates the reaction time in milliseconds by subtracting the moment green appeared from the current time.
attempts.push(rt);
Adds this round's reaction time to the end of the attempts array so it can be charted and averaged later.
if (attempts.length > 100) { attempts.shift(); // avoid unbounded growth }
Once more than 100 attempts are stored, removes the oldest one from the front of the array to keep memory usage bounded.
if (bestTime === null || rt < bestTime) { bestTime = rt; }
Updates the best (fastest) recorded time if this is the first attempt ever, or if this reaction was faster than the previous best.

windowResized()

windowResized() is a p5.js event function called automatically whenever the browser window changes size. Pairing it with resizeCanvas() is the standard pattern for building responsive, full-window sketches.

function windowResized() {
  resizeCanvas(windowWidth, windowHeight);
}
Line-by-line explanation (1 lines)
resizeCanvas(windowWidth, windowHeight);
Resizes the existing canvas to match the browser window's new dimensions whenever the user resizes their window.

📦 Key Variables

state string

The core state-machine variable driving the whole game: one of 'idle', 'waiting', 'green', 'too-early', or 'show-result'. Nearly every function reads this to decide what to draw or how to respond to clicks.

let state = 'idle';
targetChangeTime number

Stores the future millis() timestamp at which the circle should turn from red to green.

let targetChangeTime = 0;
greenStartTime number or null

Records the exact millis() timestamp when the circle turned green, used to calculate the player's reaction time.

let greenStartTime = null;
lastReactionTime number or null

Holds the most recently measured reaction time in milliseconds, shown in the circle and stats during the result screen.

let lastReactionTime = null;
bestTime number or null

Tracks the lowest (fastest) reaction time achieved so far in the session.

let bestTime = null;
attempts array

Stores every valid reaction time recorded, used for computing the rolling average and drawing the bar chart of the last 10 results.

let attempts = [];
tooEarlyStart number

Records the millis() timestamp when the 'too-early' penalty state began, so it can auto-advance after 1.5 seconds.

let tooEarlyStart = 0;
resultStart number

Records the millis() timestamp when the result screen began showing, so it can auto-advance after 1.5 seconds.

let resultStart = 0;

🔧 Potential Improvements (4)

Here are some ways this code could be enhanced:

BUG drawChart()

The 'best time' highlight uses strict equality (t === minInData) to find which bar to color green. If two attempts tie for the fastest time, both get highlighted, and if reaction times were ever rounded or stored inconsistently, the comparison could silently fail to match anything.

💡 Track the index of the minimum value directly (e.g. with a loop or indexOf) instead of relying on value equality, so exactly one bar is guaranteed to be highlighted.

PERFORMANCE draw()

color() objects are constructed fresh every single frame inside the if/else chain, even though only one branch's color is ever used per frame - this is minor but unnecessary repeated work at 60fps.

💡 Define the four state colors once as constants outside draw() (e.g. const RED = color(230,76,101);) and simply reference them, avoiding repeated color() allocation every frame.

STYLE handleStateTimers(), mousePressed()

Magic numbers like 1500 (penalty/result delay), 100 (max stored attempts), and 1000/5000 (random wait range) are scattered across multiple functions without named constants, making the game's timing hard to find and tune consistently.

💡 Extract these into named constants near the top of the file, e.g. const PENALTY_DELAY_MS = 1500; const MAX_ATTEMPTS = 100;, so all game-feel tuning happens in one visible place.

FEATURE mousePressed() / draw()

There's no keyboard support and no way to manually reset bestTime or clear attempts, so testing the game from a clean slate requires reloading the entire page.

💡 Add a keyPressed() handler so pressing spacebar acts like a click, and add a small on-screen 'Reset' control that clears bestTime and empties the attempts array.

🔄 Code Flow

Code flow showing setup, draw, handlestatetimers, drawcirclelabel, drawheader, drawstats, drawchart, getaveragelastn, startwaitingstate, mousepressed, windowresized

💡 Click on function names in the diagram to jump to their code

graph TD start[Start] --> setup[setup] setup --> draw[draw loop] draw --> handlestatetimers[handlestatetimers] handlestatetimers --> circle-color-conditional[circle-color-conditional] handlestatetimers --> green-transition[green-transition] handlestatetimers --> too-early-timeout[too-early-timeout] handlestatetimers --> result-timeout[result-timeout] draw --> drawcirclelabel[drawcirclelabel] drawcirclelabel --> label-state-conditional[label-state-conditional] draw --> drawheader[drawheader] draw --> drawstats[drawstats] drawstats --> null-fallback-ternaries[null-fallback-ternaries] draw --> drawchart[drawchart] drawchart --> chart-height-check[chart-height-check] drawchart --> bar-drawing-loop[bar-drawing-loop] bar-drawing-loop --> reduce-sum[reduce-sum] bar-drawing-loop --> best-time-highlight[best-time-highlight] draw --> mousepressed[mousepressed] mousepressed --> click-state-conditional[click-state-conditional] draw --> windowresized[windowresized] windowresized --> resizeCanvas[resizeCanvas] click setup href "#fn-setup" click draw href "#fn-draw" click handlestatetimers href "#fn-handlestatetimers" click drawcirclelabel href "#fn-drawcirclelabel" click drawheader href "#fn-drawheader" click drawstats href "#fn-drawstats" click drawchart href "#fn-drawchart" click mousepressed href "#fn-mousepressed" click windowresized href "#fn-windowresized" click circle-color-conditional href "#sub-circle-color-conditional" click shadow-circle href "#sub-shadow-circle" click chart-height-check href "#sub-chart-height-check" click green-transition href "#sub-green-transition" click too-early-timeout href "#sub-too-early-timeout" click result-timeout href "#sub-result-timeout" click label-state-conditional href "#sub-label-state-conditional" click null-fallback-ternaries href "#sub-null-fallback-ternaries" click bar-drawing-loop href "#sub-bar-drawing-loop" click best-time-highlight href "#sub-best-time-highlight" click reduce-sum href "#sub-reduce-sum" click click-state-conditional href "#sub-click-state-conditional" click attempts-cap href "#sub-attempts-cap"

❓ Frequently Asked Questions

What visual elements does the AI Reaction Time Test sketch display?

The sketch features a central circle that changes color based on the game's state, along with dynamic text instructions and statistics displayed on the screen.

How can users participate in the AI Reaction Time Test game?

Users interact by waiting for the circle to turn green and then clicking as quickly as possible to measure their reaction time.

What creative coding concepts are highlighted in this p5.js sketch?

The sketch demonstrates state management, timed transitions, and user interaction, showcasing how to create an engaging real-time game experience.

Preview

AI Reaction Time Test - Speed Challenge Game Test your reflexes! Wait for the circle to turn green, - p5.js creative coding sketch preview
Sketch Preview
Code flow diagram showing the structure of AI Reaction Time Test - Speed Challenge Game Test your reflexes! Wait for the circle to turn green, - Code flow showing setup, draw, handlestatetimers, drawcirclelabel, drawheader, drawstats, drawchart, getaveragelastn, startwaitingstate, mousepressed, windowresized
Code Flow Diagram
