AI Sound Wave Terrain - Interactive Frequency Mesh Visualization - xelsed.ai

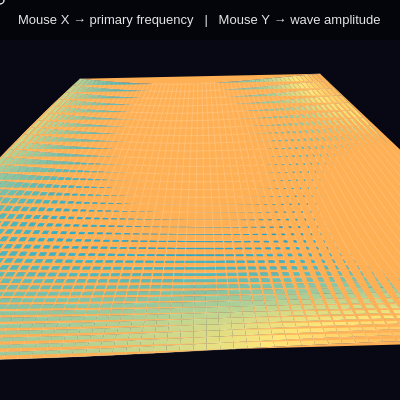
This sketch renders an animated 3D-style terrain mesh made of sine waves, where the mouse controls both the frequency of the ripples (X axis) and how tall the peaks and valleys become (Y axis). The mesh is colored with a height-based gradient running from deep blue valleys through cyan and yellow up to fiery orange peaks, giving the impression of a glowing audio-frequency landscape.

🧪 Try This!

Experiment with the code by making these changes:

  1. Increase terrain detail — Doubling the number of columns makes the mesh much finer and smoother, at the cost of extra computation each frame.
  2. Speed up the wave animation — Increasing the time multiplier makes the ripples scroll and shift noticeably faster, even without moving the mouse.
  3. Recolor the mountain peaks — Changing the peak color swaps the fiery orange summit tone for a completely different hue, instantly changing the sketch's mood.
Prefer the full editor? Open it there →

📖 About This Sketch

This sketch builds a fake perspective landscape out of a grid of points whose heights come from three overlapping sine waves, similar to how audio frequencies interfere with each other. Moving the mouse left-to-right changes the primary wave frequency, while moving it top-to-bottom changes the amplitude, so the terrain can look like gentle rolling hills or jagged violent peaks depending on where you point. The color of every patch of ground is derived from its height using lerpColor(), sliding smoothly from deep blue through cyan and yellow into orange and red.

The code is organized around a single draw() loop that recalculates a 2D grid of screen positions and heights every frame, then renders that grid as a mesh of colored quads plus overlaid wireframe lines using beginShape()/vertex()/endShape(). Helper functions separate the concerns cleanly: computeHeight() does the wave math, heightToColor() does the color mapping, and drawMouseIndicator() draws the on-screen HUD. Studying this sketch teaches you how to fake perspective with simple lerp-based scaling, how to layer multiple sin() waves into a richer signal, and how to turn a single numeric height value into a smooth multi-stop color gradient.

⚙️ How It Works

  1. When the sketch loads, setup() creates a full-window canvas, hides the system cursor, and defines four base colors used for the height gradient.
  2. Every frame, draw() reads the mouse position and converts it into a primaryFreq value (from X) and an amplitude value (from Y) using map().
  3. draw() then loops over a ROWS x COLS grid, calling computeHeight() at each point to combine three sine waves into a single height value, and computes a perspective-adjusted screen position for that point so far-away rows appear smaller and higher up.
  4. The grid is rendered twice: first as filled, colored quads (using heightToColor() to pick a color per cell) to create the solid terrain surface, then as thin semi-transparent grid lines to emphasize the mesh structure.
  5. A small HUD box and a circle following the mouse are drawn last via drawMouseIndicator(), reminding the viewer that X controls frequency and Y controls amplitude.
  6. Because frameCount constantly increases, the time variable t keeps advancing every frame, so even with the mouse still, the waves keep scrolling and the terrain never freezes.

🎓 Concepts You'll Learn

3D-style terrain via perspective scalingSine wave interference / layered oscillatorsMouse-driven parameter mappingbeginShape/vertex/endShape mesh renderingHeight-based color gradients with lerpColorPer-frame recomputation of a data grid

📝 Code Breakdown

setup()

setup() runs exactly once when the sketch starts. It is the right place to configure the canvas size and pre-create any color() objects you'll reuse every frame, instead of recreating them 60 times per second inside draw().

function setup() {
  // Create full-window canvas (ref: https://p5js.org/reference/#/p5/createCanvas)
  createCanvas(windowWidth, windowHeight);
  noCursor();

  // Define base colors (ref: https://p5js.org/reference/#/p5/color)
  colDeepBlue   = color(8, 30, 90);    // deep valley blue
  colBlueGreen  = color(40, 170, 200); // mid low cyan/green
  colYellow     = color(255, 230, 120); // mid-high yellow
  colRedOrange  = color(255, 80, 20);   // peak orange/red
}
Line-by-line explanation (6 lines)
createCanvas(windowWidth, windowHeight);
Makes the canvas fill the entire browser window, using p5.js's built-in windowWidth/windowHeight variables.
noCursor();
Hides the default system mouse cursor so only the custom circle indicator (drawn later) shows where the mouse is.
colDeepBlue = color(8, 30, 90); // deep valley blue
Creates a p5.Color object for the darkest, lowest terrain points - a deep navy blue.
colBlueGreen = color(40, 170, 200); // mid low cyan/green
A mid-low color used for gently sloped, low-mid height terrain.
colYellow = color(255, 230, 120); // mid-high yellow
A warm mid-high color that terrain shifts toward as it rises.
colRedOrange = color(255, 80, 20); // peak orange/red
The hottest color, reserved for the very tallest peaks in the terrain.

draw()

draw() runs continuously at roughly 60 frames per second. This particular draw() rebuilds an entire 2D data grid from scratch every single frame - a common and expensive-but-flexible pattern for terrain and particle systems where every point's state depends on live inputs like mouseX/mouseY and time.

🔬 These two lines convert a flat grid coordinate into a screen position with fake perspective. What happens if you remove the * perspective multiplier from xScreen (just use u * width) - does the depth illusion collapse?

      const xScreen = width / 2 + u * width * perspective;
      const yScreen = yBase - h * perspective * 0.4; // higher height -> visually higher

🔬 This loop draws the vertical ridge lines connecting each column front-to-back. What happens if you comment out this entire block - does the terrain still read as 3D without the column lines, using only the filled quads and row lines?

  for (let c = 0; c < COLS; c++) {
    beginShape();
    for (let r = 0; r < ROWS; r++) {
      const p = positions[r][c];
      vertex(p.x, p.y);
    }
    endShape();
  }
function draw() {
  background(8, 8, 20); // dark night sky

  // Time variable for smooth animation
  const t = frameCount * 0.015;

  // Mouse-driven controls (ref: https://p5js.org/reference/#/p5/map)
  const mx = constrain(mouseX, 0, width);
  const my = constrain(mouseY, 0, height);

  // Primary spatial frequency: left = low, right = high
  const primaryFreq = map(mx, 0, width, 0.6, 2.5);

  // Amplitude: top = small waves, bottom = big mountains
  const amplitude = map(my, 0, height, 40, 220);

  // Precompute positions & heights for this frame
  const positions = new Array(ROWS);
  const heights = new Array(ROWS);

  for (let r = 0; r < ROWS; r++) {
    positions[r] = new Array(COLS);
    heights[r] = new Array(COLS);

    // Depth from front (0) to back (1)
    const depth = r / (ROWS - 1);

    // Perspective scaling: near rows appear wider, far rows narrower
    const perspective = lerp(2.0, 0.6, depth);

    // Base vertical position: near rows lower on screen, far rows higher
    const yBase = lerp(height * 0.9, height * 0.2, depth);

    for (let c = 0; c < COLS; c++) {
      // Normalized coordinates in "world space"
      const u = c / (COLS - 1) - 0.5; // -0.5 .. 0.5 horizontally
      const v = depth;                // 0 .. 1 in depth

      // Height from overlapping sine waves
      const h = computeHeight(u, v, t, primaryFreq, amplitude);
      heights[r][c] = h;

      // Perspective-mapped screen position
      const xScreen = width / 2 + u * width * perspective;
      const yScreen = yBase - h * perspective * 0.4; // higher height -> visually higher

      positions[r][c] = { x: xScreen, y: yScreen, depth, perspective };
    }
  }

  // Draw filled terrain mesh
  noStroke(); // we'll add subtle grid lines afterwards

  for (let r = 0; r < ROWS - 1; r++) {
    for (let c = 0; c < COLS - 1; c++) {
      const p00 = positions[r][c];
      const p10 = positions[r][c + 1];
      const p01 = positions[r + 1][c];
      const p11 = positions[r + 1][c + 1];

      const h00 = heights[r][c];
      const h10 = heights[r][c + 1];
      const h01 = heights[r + 1][c];
      const h11 = heights[r + 1][c + 1];

      const hAvg = (h00 + h10 + h01 + h11) / 4;

      // Height-based color: valleys -> blue, peaks -> orange/red
      const terrainColor = heightToColor(hAvg, amplitude);
      fill(terrainColor);

      // Quad for this grid cell (ref: https://p5js.org/reference/#/p5/beginShape)
      beginShape();
      vertex(p00.x, p00.y);
      vertex(p10.x, p10.y);
      vertex(p11.x, p11.y);
      vertex(p01.x, p01.y);
      endShape(CLOSE);
    }
  }

  // Subtle grid lines connecting points
  stroke(255, 255, 255, 45);
  strokeWeight(1);

  // Lines along rows (front-to-back bands)
  for (let r = 0; r < ROWS; r++) {
    beginShape();
    for (let c = 0; c < COLS; c++) {
      const p = positions[r][c];
      vertex(p.x, p.y);
    }
    endShape();
  }

  // Lines along columns (left-to-right ridges)
  for (let c = 0; c < COLS; c++) {
    beginShape();
    for (let r = 0; r < ROWS; r++) {
      const p = positions[r][c];
      vertex(p.x, p.y);
    }
    endShape();
  }

  // Optional: small cursor indicator to emphasize mouse control
  drawMouseIndicator(primaryFreq, amplitude);
}

Line-by-line explanation (14 lines)

🔧 Subcomponents:

for-loop Compute Terrain Grid for (let r = 0; r < ROWS; r++) {

Loops through every row and column of the grid, calling computeHeight() for each point and storing its height and perspective-adjusted screen position.

for-loop Draw Filled Terrain Quads for (let r = 0; r < ROWS - 1; r++) {

Iterates over each grid cell, averages the four corner heights to pick a color, and draws a filled quad connecting the four neighboring points.

for-loop Draw Row Grid Lines for (let r = 0; r < ROWS; r++) {

Draws one continuous line across each row using vertex(), producing the horizontal wireframe bands.

for-loop Draw Column Grid Lines for (let c = 0; c < COLS; c++) {

Draws one continuous line down each column, producing the vertical wireframe ridges that emphasize depth.

background(8, 8, 20); // dark night sky
Clears the canvas to a very dark navy color every frame, which also serves as the night-sky backdrop.
const t = frameCount * 0.015;
Creates a slowly increasing time value from p5's built-in frameCount, used to animate the waves over time.
const mx = constrain(mouseX, 0, width);
Clamps the mouse X position so it never goes outside the canvas, even if the cursor leaves the window.
const primaryFreq = map(mx, 0, width, 0.6, 2.5);
Converts mouse X (0 to width) into a frequency multiplier between 0.6 (slow, wide waves) and 2.5 (fast, tight waves).
const amplitude = map(my, 0, height, 40, 220);
Converts mouse Y into how tall the terrain's peaks and valleys can get, from 40 (subtle) to 220 (dramatic).
const depth = r / (ROWS - 1);
Normalizes the current row index to a 0..1 range representing how far back into the scene this row sits.
const perspective = lerp(2.0, 0.6, depth);
Interpolates a scaling factor so near rows (depth near 0) are drawn wider (2.0x) and far rows (depth near 1) are narrower (0.6x), faking perspective.
const h = computeHeight(u, v, t, primaryFreq, amplitude);
Calls the helper function to calculate this specific grid point's terrain height from overlapping sine waves.
const xScreen = width / 2 + u * width * perspective;
Converts the normalized horizontal coordinate u into an actual pixel X position, scaled by the perspective factor so far rows appear compressed toward the center.
const yScreen = yBase - h * perspective * 0.4; // higher height -> visually higher
Shifts the point upward on screen based on its height, so tall peaks visually rise above their base row position.
const hAvg = (h00 + h10 + h01 + h11) / 4;
Averages the four corner heights of a grid cell so a single representative color can be chosen for that whole quad.
const terrainColor = heightToColor(hAvg, amplitude);
Looks up the gradient color that corresponds to this cell's average height.
beginShape();
Starts recording a custom polygon shape whose vertices will be added with vertex() calls.
endShape(CLOSE);
Finishes the shape and connects the last vertex back to the first, closing the quad so it renders as a solid filled polygon.

computeHeight()

This function is the mathematical heart of the sketch. Summing multiple sine waves with different frequencies, directions, and phase offsets is exactly how audio synthesis and terrain generation both simulate complex signals from simple building blocks.

🔬 This weighted sum blends three sine waves into one terrain height. What happens if you zero out wave3's contribution (change 0.5 * wave3 to 0 * wave3) - does the diagonal ripple pattern disappear from the terrain?

  const wave1 = sin((u * primaryFreq + t * 0.75) * TWO_PI);          // left-right
  const wave2 = sin((v * primaryFreq * 1.7 - t * 0.45) * TWO_PI);    // front-back
  const wave3 = sin(((u + v) * primaryFreq * 0.9 + t * 1.1) * TWO_PI); // diagonal

  // Weighted sum, normalized closer to [-1, 1]
  const combined = (0.6 * wave1 + 0.4 * wave2 + 0.5 * wave3) / (0.6 + 0.4 + 0.5);
function computeHeight(u, v, t, primaryFreq, amplitude) {
  // A few harmonically-related waves at different directions / speeds
  const wave1 = sin((u * primaryFreq + t * 0.75) * TWO_PI);          // left-right
  const wave2 = sin((v * primaryFreq * 1.7 - t * 0.45) * TWO_PI);    // front-back
  const wave3 = sin(((u + v) * primaryFreq * 0.9 + t * 1.1) * TWO_PI); // diagonal

  // Weighted sum, normalized closer to [-1, 1]
  const combined = (0.6 * wave1 + 0.4 * wave2 + 0.5 * wave3) / (0.6 + 0.4 + 0.5);

  return combined * amplitude;
}
Line-by-line explanation (5 lines)

🔧 Subcomponents:

calculation Left-Right Wave const wave1 = sin((u * primaryFreq + t * 0.75) * TWO_PI); // left-right

A sine wave that oscillates along the horizontal (u) axis and scrolls over time.

calculation Front-Back Wave const wave2 = sin((v * primaryFreq * 1.7 - t * 0.45) * TWO_PI); // front-back

A sine wave that oscillates along the depth (v) axis at a different frequency and scroll direction.

calculation Diagonal Wave const wave3 = sin(((u + v) * primaryFreq * 0.9 + t * 1.1) * TWO_PI); // diagonal

A sine wave that runs diagonally by combining u and v together, adding a third direction of ripple.

calculation Weighted Blend const combined = (0.6 * wave1 + 0.4 * wave2 + 0.5 * wave3) / (0.6 + 0.4 + 0.5);

Blends the three waves using fixed weights, then divides by the total weight so the result stays roughly within -1..1.

const wave1 = sin((u * primaryFreq + t * 0.75) * TWO_PI); // left-right
Multiplies the horizontal coordinate u by the mouse-controlled frequency, adds a time offset so it scrolls, and wraps it into a full sine cycle using TWO_PI.
const wave2 = sin((v * primaryFreq * 1.7 - t * 0.45) * TWO_PI); // front-back
Same idea but driven by depth (v) at 1.7x the frequency and scrolling backward in time (minus sign), giving a different rhythm.
const wave3 = sin(((u + v) * primaryFreq * 0.9 + t * 1.1) * TWO_PI); // diagonal
Adds u and v together before applying frequency, so this wave travels diagonally across the grid instead of purely horizontally or in depth.
const combined = (0.6 * wave1 + 0.4 * wave2 + 0.5 * wave3) / (0.6 + 0.4 + 0.5);
Combines all three waves using different weights (0.6, 0.4, 0.5) so wave1 dominates slightly, then divides by the sum of weights to keep the result within roughly -1 to 1.
return combined * amplitude;
Scales the normalized wave value by the mouse-controlled amplitude, turning a -1..1 ripple into an actual pixel height like -220 to 220.

heightToColor()

This function demonstrates a multi-stop gradient built from three separate lerpColor() calls, each covering its own slice of the 0..1 range. This is a common technique whenever you need more than two colors in a smooth gradient, since lerpColor() itself only blends between two colors at a time.

🔬 The 0.3 threshold decides how much of the terrain counts as 'deep valley' blue. What happens if you lower it to 0.1 - do the blue valleys shrink to a thin band near the very bottom?

  if (h01 < 0.3) {
    // Deep valley to low mid: deep blue -> blue-green
    const t = h01 / 0.3;
    return lerpColor(colDeepBlue, colBlueGreen, t);
  } else if (h01 < 0.7) {
function heightToColor(h, amp) {
  // Normalize to 0..1 based on current amplitude
  const h01 = map(h, -amp, amp, 0, 1, true);

  if (h01 < 0.3) {
    // Deep valley to low mid: deep blue -> blue-green
    const t = h01 / 0.3;
    return lerpColor(colDeepBlue, colBlueGreen, t);
  } else if (h01 < 0.7) {
    // Mid range: blue-green -> yellow
    const t = (h01 - 0.3) / 0.4;
    return lerpColor(colBlueGreen, colYellow, t);
  } else {
    // High peaks: yellow -> red/orange
    const t = (h01 - 0.7) / 0.3;
    return lerpColor(colYellow, colRedOrange, t);
  }
}
Line-by-line explanation (9 lines)

🔧 Subcomponents:

conditional Low Band (Blue to Blue-Green) if (h01 < 0.3) {

Handles the bottom 30% of the height range, blending from deep blue to blue-green.

conditional Mid Band (Blue-Green to Yellow) } else if (h01 < 0.7) {

Handles the middle 40% of the height range, blending from blue-green to yellow.

conditional High Band (Yellow to Red/Orange) } else {

Handles the top 30% of the height range, blending from yellow to red-orange for the tallest peaks.

const h01 = map(h, -amp, amp, 0, 1, true);
Rescales the raw height (which ranges from -amp to +amp) into a simple 0..1 percentage, clamped (the true argument) so it never goes below 0 or above 1.
if (h01 < 0.3) {
Checks if this point is in the bottom 30% of the height range - the deepest valleys.
const t = h01 / 0.3;
Re-normalizes h01 (which is between 0 and 0.3 here) into its own local 0..1 range so lerpColor can blend smoothly within this band.
return lerpColor(colDeepBlue, colBlueGreen, t);
Blends between deep blue and blue-green based on t, returning a smoothly interpolated p5.Color.
} else if (h01 < 0.7) {
Checks if the height falls in the middle 40% band (0.3 to 0.7).
const t = (h01 - 0.3) / 0.4;
Shifts and rescales h01 so the mid-band itself maps to a fresh 0..1 range for blending.
return lerpColor(colBlueGreen, colYellow, t);
Blends between blue-green and yellow for mid-height terrain.
const t = (h01 - 0.7) / 0.3;
Rescales the top 30% of the range into its own 0..1 value for the final blend.
return lerpColor(colYellow, colRedOrange, t);
Blends between yellow and red-orange, giving the very tallest peaks the hottest colors.

drawMouseIndicator()

This function is a good example of separating HUD/UI drawing from the main visual logic. Keeping the instructional overlay in its own function makes draw() easier to read and lets you toggle the HUD on or off with a single function call.

🔬 The indicator circle grows as amplitude increases. What happens if you swap the output range (8, 18) to (18, 8), so the circle shrinks instead as amplitude goes up?

  const size = map(amplitude, 40, 220, 8, 18);
  stroke(255, 230);
  strokeWeight(1.5);
  noFill();
  circle(mx, my, size); // ref: https://p5js.org/reference/#/p5/circle
function drawMouseIndicator(primaryFreq, amplitude) {
  // Soft vignette at top for text legibility
  noStroke();
  fill(0, 0, 0, 120);
  rect(0, 0, width, 40);

  fill(230);
  textSize(13);
  textAlign(LEFT, CENTER);
  text(
    "Mouse X → primary frequency   |   Mouse Y → wave amplitude",
    18,
    20
  );

  // Tiny circle showing where the "control point" is
  const mx = constrain(mouseX, 0, width);
  const my = constrain(mouseY, 0, height);
  const size = map(amplitude, 40, 220, 8, 18);
  stroke(255, 230);
  strokeWeight(1.5);
  noFill();
  circle(mx, my, size); // ref: https://p5js.org/reference/#/p5/circle
}
Line-by-line explanation (5 lines)
fill(0, 0, 0, 120);
Sets a semi-transparent black fill, used to darken the top strip of the screen so the white instructional text stays readable over the busy terrain.
rect(0, 0, width, 40);
Draws a full-width dark bar at the top of the canvas, 40 pixels tall, as a background for the HUD text.
text("Mouse X → primary frequency | Mouse Y → wave amplitude", 18, 20);
Displays the instructional text near the top-left corner, telling the viewer what each mouse axis controls.
const size = map(amplitude, 40, 220, 8, 18);
Maps the current amplitude value into a circle diameter between 8 and 18 pixels, so the indicator grows slightly as the terrain gets more extreme.
circle(mx, my, size); // ref: https://p5js.org/reference/#/p5/circle
Draws an outlined (unfilled) circle at the clamped mouse position, visually marking the 'control point' driving the terrain.

windowResized()

windowResized() is a special p5.js callback that fires automatically whenever the browser window changes size. Pairing it with resizeCanvas() is the standard way to keep a full-window sketch responsive without any extra event-listener code.

function windowResized() {
  // Keep canvas full-window when resized
  // ref: https://p5js.org/reference/#/p5/resizeCanvas
  resizeCanvas(windowWidth, windowHeight);
}
Line-by-line explanation (1 lines)
resizeCanvas(windowWidth, windowHeight);
Resizes the existing canvas to match the browser window's new dimensions whenever the user resizes their window.

📦 Key Variables

COLS number

Constant defining how many points span the terrain grid horizontally (left to right).

const COLS = 60;  // horizontal points
ROWS number

Constant defining how many points span the terrain grid in depth (front to back).

const ROWS = 40;  // depth points
colDeepBlue object

Stores the p5.Color used for the deepest, lowest terrain valleys.

colDeepBlue = color(8, 30, 90);
colBlueGreen object

Stores the p5.Color used for low-to-mid height terrain, between deep blue and yellow.

colBlueGreen = color(40, 170, 200);
colYellow object

Stores the p5.Color used for mid-to-high terrain, between blue-green and red-orange.

colYellow = color(255, 230, 120);
colRedOrange object

Stores the p5.Color used for the very tallest peaks in the terrain.

colRedOrange = color(255, 80, 20);

🔧 Potential Improvements (4)

Here are some ways this code could be enhanced:

PERFORMANCE draw() grid computation loop

Every single frame, draw() allocates brand-new arrays (positions, heights) and a new plain object { x, y, depth, perspective } for every one of the COLS*ROWS grid points. At 60fps with a 60x40 grid, that's over 100,000 object allocations per second, which puts heavy pressure on JavaScript's garbage collector and can cause frame stutters.

💡 Preallocate the positions/heights arrays once outside draw() (e.g. in setup(), sized to ROWS*COLS) and mutate the existing objects' properties each frame instead of creating new ones with new Array() and object literals.

FEATURE draw() mouse controls

The sketch relies entirely on mouseX/mouseY, which don't update from touches on mobile/tablet devices, so touch-only visitors will only ever see the default (0,0) mapping and never experience the interactivity.

💡 Add a touchMoved() function that mirrors mouseX/mouseY behavior using touches[0].x and touches[0].y, and return false inside it to prevent the page from scrolling.

STYLE heightToColor() and computeHeight()

Several important tuning values are hard-coded magic numbers scattered through the code (0.3 and 0.7 thresholds, 0.6/0.4/0.5 wave weights, 40/220 amplitude range), making them hard to find and adjust consistently.

💡 Extract these into named constants near the top of the file (e.g. const VALLEY_THRESHOLD = 0.3, const WAVE_WEIGHTS = { w1: 0.6, w2: 0.4, w3: 0.5 }) so they're easier to locate, document, and tune together.

PERFORMANCE draw() quad-drawing loop

heightToColor() is called once per quad (up to (COLS-1)*(ROWS-1) times per frame) and internally calls lerpColor(), which is a relatively expensive operation to run thousands of times per second.

💡 Precompute a color lookup table (e.g. 256 pre-blended color stops) once, then index into it using the mapped height percentage instead of calling lerpColor() fresh for every single quad every frame.

🔄 Code Flow

Code flow showing setup, draw, computeheight, heighttocolor, drawmouseindicator, windowresized

💡 Click on function names in the diagram to jump to their code

graph TD start[Start] --> setup[setup] setup --> draw[draw loop] draw --> computegridloop[compute-grid-loop] computegridloop --> wave1calc[wave1-calc] wave1calc --> wave2calc[wave2-calc] wave2calc --> wave3calc[wave3-calc] wave3calc --> combinedcalc[combined-calc] combinedcalc --> lowband[low-band] combinedcalc --> midband[mid-band] combinedcalc --> highband[high-band] computegridloop --> drawquadsloop[draw-quads-loop] drawquadsloop --> rowlinesloop[row-lines-loop] rowlinesloop --> collinesloop[col-lines-loop] draw --> drawmouseindicator[drawmouseindicator] draw --> windowresized[windowresized] click setup href "#fn-setup" click draw href "#fn-draw" click computegridloop href "#sub-compute-grid-loop" click wave1calc href "#sub-wave1-calc" click wave2calc href "#sub-wave2-calc" click wave3calc href "#sub-wave3-calc" click combinedcalc href "#sub-combined-calc" click lowband href "#sub-low-band" click midband href "#sub-mid-band" click highband href "#sub-high-band" click drawquadsloop href "#sub-draw-quads-loop" click rowlinesloop href "#sub-row-lines-loop" click collinesloop href "#sub-col-lines-loop" click drawmouseindicator href "#fn-drawmouseindicator" click windowresized href "#fn-windowresized"

❓ Frequently Asked Questions

What visual effects are created by the AI Sound Wave Terrain sketch?

The sketch generates a mesmerizing 3D terrain that deforms based on overlapping wave frequencies, showcasing a vibrant color gradient from deep blue valleys to fiery orange peaks.

How can users interact with the AI Sound Wave Terrain sketch?

Users can control the primary frequency and wave amplitude by moving their mouse, which directly influences the shape and appearance of the terrain.

What creative coding concepts are demonstrated in the AI Sound Wave Terrain sketch?

This sketch illustrates the concept of interactive visualizations through real-time data manipulation, using sine waves to create dynamic terrain based on user input.

Preview

AI Sound Wave Terrain - Interactive Frequency Mesh Visualization - xelsed.ai - p5.js creative coding sketch preview
Sketch Preview
Code flow diagram showing the structure of AI Sound Wave Terrain - Interactive Frequency Mesh Visualization - xelsed.ai - Code flow showing setup, draw, computeheight, heighttocolor, drawmouseindicator, windowresized
Code Flow Diagram