setup()
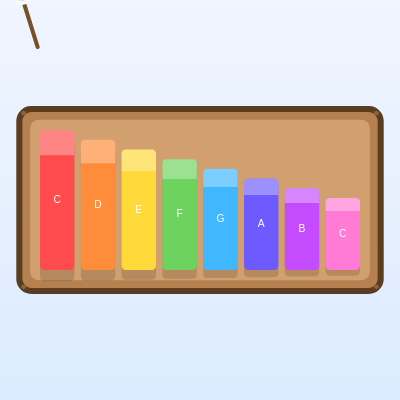
setup() runs once when the sketch starts. It's the right place to configure the canvas and build any objects (like the bars array here) before the animation loop begins.
function setup() {
  createCanvas(windowWidth, windowHeight);
  noStroke();
  textFont('sans-serif');
  colorMode(RGB);
  noCursor(); // hide mouse, we draw mallets instead

  // create bars
  for (let i = 0; i < NOTE_DATA.length; i++) {
    const note = NOTE_DATA[i];
    const col = BAR_COLORS[i % BAR_COLORS.length];
    bars.push(new XyloBar(i, note.name, note.freq, col));
  }

  layoutBars();
}
Line-by-line explanation (10 lines)
🔧 Subcomponents:
for-loop
Create Bars
for (let i = 0; i < NOTE_DATA.length; i++) {
Creates one XyloBar object for each note defined in NOTE_DATA, pairing it with a rainbow color
createCanvas(windowWidth, windowHeight);- Makes the canvas fill the entire browser window
noStroke();- Turns off outlines by default so shapes are drawn as solid fills unless stroke() is called later
textFont('sans-serif');- Sets the font used later when drawing note labels on the bars
colorMode(RGB);- Explicitly sets color mode to red/green/blue (the default), used for clarity
noCursor();- Hides the system mouse pointer since the sketch draws its own mallet graphics instead
for (let i = 0; i < NOTE_DATA.length; i++) {- Loops once for each of the 8 notes in the scale
const note = NOTE_DATA[i];- Grabs the note name and frequency for this position in the loop
const col = BAR_COLORS[i % BAR_COLORS.length];- Picks a rainbow color for this bar, wrapping around with modulo in case there are more notes than colors
bars.push(new XyloBar(i, note.name, note.freq, col));- Creates a new bar object and adds it to the bars array
layoutBars();- Calculates the size and position of every bar now that they all exist