
aktinometr

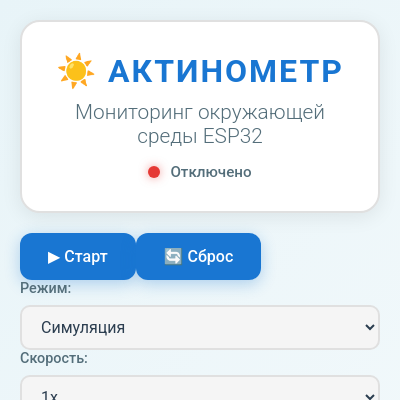
Aktinometr is an environmental monitoring dashboard that displays real-time solar radiation, temperature, and humidity data with animated graphs and statistics. It can simulate realistic sensor data with daily cycles or connect to an ESP32 microcontroller via WebSocket for live measurements.

🧪 Try This!

Experiment with the code by making these changes:

  1. Make the simulation run twice as fast — Change the timeScale default so the sun rises and sets much quicker, compressing a day cycle into seconds
  2. Make the graph show 50 readings instead of 100 — A shorter history window zooms in on recent data, showing less of the past timeline
  3. Change temperature line color from blue to red — Recolor one graph line to visually distinguish it better
  4. Make the animation smoother with slower lerp — Lower lerp value (0.01 instead of 0.05) creates more gradual, liquid-smooth transitions
  5. Show the maximum temperature as 100°C — Stretches the temperature scale upward, so hot days take up more of the graph
Prefer the full editor? Open it there →

📖 About This Sketch

Aktinometr creates a professional environmental monitoring interface that displays three environmental sensors: solar radiation (in Watts per square meter), temperature (in Celsius), and humidity (as a percentage). The sketch uses WebSocket connections for live data from an ESP32 microcontroller, or simulates realistic sensor readings with natural daily cycles using Perlin noise and trigonometry. Three key p5.js techniques power this sketch: the draw loop for continuous animation, Bezier curves via beginShape/vertex for smooth graphing, and the map() function to scale sensor values into canvas coordinates.

The code is organized into three main classes: WeatherStation manages all sensor data and graphing logic, ESP32Connection handles WebSocket communication with hardware, and GUI creates and updates the user interface elements. By studying it you will learn how to build data visualization dashboards, coordinate multiple animated elements on a canvas, simulate realistic sensor behavior, and connect p5.js sketches to external hardware using WebSocket protocols.

⚙️ How It Works

  1. When the sketch loads, setup() creates a p5.js canvas with responsive sizing, instantiates a WeatherStation object to manage data, and creates a GUI object that builds buttons, dropdowns, and display cards using the DOM.
  2. On every frame, draw() clears the background, calls station.update() to advance the simulation or receive new ESP32 data, then calls station.display() to redraw the graph with the current history arrays.
  3. The WeatherStation.update() method either simulates realistic data using sine waves and Perlin noise (creating daily radiation cycles and correlated temperature/humidity changes) or waits for live data from the ESP32. Either way, it uses lerp() to smoothly animate from current values to target values.
  4. Every 5 frames, fresh sensor readings are added to history arrays (radiationHistory, temperatureHistory, humidityHistory), and the oldest values are removed when the array exceeds 100 entries, creating a rolling window of recent data.
  5. DrawGraph() renders three overlapping line graphs by iterating through each history array and plotting points using map() to scale values onto the canvas. A grid and legend help users interpret the three colored lines.
  6. The GUI class updates sensor cards and statistics panels every frame using .toFixed(1) to format numbers, displaying min/max/average values calculated from the history arrays.

🎓 Concepts You'll Learn

WebSocket communicationReal-time data visualizationPerlin noise for natural variationSmoothing with lerp()Multi-series line graphsCanvas scaling with map()Rolling data buffersDOM element creationStatistics calculation

📝 Code Breakdown

setup()

setup() runs once when the sketch starts. Use it to initialize your canvas, load data, and prepare global objects. Everything here happens before the draw loop begins.

function setup() {
  let canvas = createCanvas(min(windowWidth - 40, 1200), 400);
  canvas.parent('canvas-container');
  
  station = new WeatherStation();
  gui = new GUI();
  
  textFont('Roboto');
}
Line-by-line explanation (5 lines)

🔧 Subcomponents:

calculation Responsive canvas sizing let canvas = createCanvas(min(windowWidth - 40, 1200), 400);

Creates a canvas that is 1200px wide max, but shrinks on small screens to fit in the viewport with 40px padding

calculation Class initialization station = new WeatherStation(); gui = new GUI();

Creates global instances of the two main classes that manage data and UI

let canvas = createCanvas(min(windowWidth - 40, 1200), 400);
Creates a p5.js canvas that is at most 1200 pixels wide but shrinks on small screens. The height is always 400 pixels. The min() function picks whichever is smaller.
canvas.parent('canvas-container');
Tells p5.js to place the canvas inside the HTML element with id 'canvas-container' instead of at the top of the page
station = new WeatherStation();
Creates a new WeatherStation object that will manage all sensor data, history arrays, and graphing logic
gui = new GUI();
Creates a new GUI object that builds all the buttons, dropdowns, sensor cards, and statistics panels
textFont('Roboto');
Sets the font for all text drawn by p5.js to 'Roboto', which matches the Google Font loaded in HTML
draw()

draw() runs 60 times per second (the animation loop). Every line here runs 60 times per second, so put only the most critical updates here. Use setup() for one-time initialization.

function draw() {
  background(245, 248, 250);
  
  station.update();
  station.display();
  
  gui.update();
}
Line-by-line explanation (4 lines)

🔧 Subcomponents:

calculation Canvas clearing background(245, 248, 250);

Erases the previous frame's drawing with a light blue-gray color, preventing trails

calculation Data update station.update(); station.display();

Advances sensor simulation/receives ESP32 data, adds to history, and redraws the graph

calculation UI refresh gui.update();

Updates all DOM elements (sensor cards and statistics) with the latest values

background(245, 248, 250);
Fills the canvas with a light blue-gray color (RGB: 245, 248, 250). This erases everything drawn last frame so new drawings don't trail.
station.update();
Calls the WeatherStation.update() method, which either simulates new sensor readings or receives data from ESP32, then smoothly animates current values toward targets using lerp()
station.display();
Calls WeatherStation.display(), which calls drawGraph() to render the three animated line graphs showing history of radiation, temperature, and humidity
gui.update();
Calls GUI.update(), which refreshes all the HTML DOM elements—sensor cards and statistics panels—with the latest sensor values formatted to one decimal place

windowResized()

windowResized() is a built-in p5.js function that fires whenever the window is resized. It ensures your canvas and all drawings stay responsive to the viewport size.

function windowResized() {
  resizeCanvas(min(windowWidth - 40, 1200), 400);
  station.updateDimensions();
}
Line-by-line explanation (2 lines)

🔧 Subcomponents:

calculation Canvas resize resizeCanvas(min(windowWidth - 40, 1200), 400);

Responds to window resize events by adjusting canvas size to fit the new viewport

calculation Graph boundary recalculation station.updateDimensions();

Recalculates graph boundaries (graphX, graphY, graphWidth, graphHeight) to fit the new canvas size

resizeCanvas(min(windowWidth - 40, 1200), 400);
p5.js calls this automatically when the user resizes their browser window. It resizes the canvas to the new width (capped at 1200px) while keeping height at 400px
station.updateDimensions();
Calls WeatherStation.updateDimensions() to recalculate where the graph should be positioned on the resized canvas so it still fills the space correctly

ESP32Connection()

WebSocket is a protocol for real-time two-way communication. This class handles all the connection plumbing so the rest of the sketch just calls station.updateFromESP32() whenever new sensor data arrives.

class ESP32Connection {
  constructor() {
    this.socket = null;
    this.connected = false;
    this.serverUrl = '';
  }
  
  connect(url) {
    try {
      this.serverUrl = url;
      this.socket = new WebSocket(url);
      
      this.socket.onopen = () => {
        this.connected = true;
        console.log('✅ Подключено к ESP32');
        this.updateStatus(true);
      };
      
      this.socket.onmessage = (event) => {
        try {
          let data = JSON.parse(event.data);
          if (data.radiation !== undefined && data.temperature !== undefined && data.humidity !== undefined) {
            station.updateFromESP32(data.radiation, data.temperature, data.humidity);
          }
        } catch (e) {
          console.error('Ошибка парсинга данных:', e);
        }
      };
      
      this.socket.onerror = (error) => {
        console.error('❌ Ошибка WebSocket:', error);
        this.connected = false;
        this.updateStatus(false);
      };
      
      this.socket.onclose = () => {
        this.connected = false;
        console.log('🔌 Отключено от ESP32');
        this.updateStatus(false);
        
        setTimeout(() => {
          if (!this.connected && this.serverUrl) {
            console.log('🔄 Попытка переподключения...');
            this.connect(this.serverUrl);
          }
        }, 5000);
      };
      
    } catch (e) {
      console.error('Ошибка подключения:', e);
      this.connected = false;
      this.updateStatus(false);
    }
  }
  
  disconnect() {
    if (this.socket) {
      this.socket.close();
      this.socket = null;
      this.connected = false;
      this.serverUrl = '';
      this.updateStatus(false);
    }
  }
  
  updateStatus(connected) {
    let indicator = document.querySelector('.status-indicator');
    let text = document.querySelector('.status-text');
    
    if (indicator && text) {
      if (connected) {
        indicator.classList.add('connected');
        text.textContent = 'Подключено к ESP32';
      } else {
        indicator.classList.remove('connected');
        text.textContent = 'Отключено';
      }
    }
  }
}
Line-by-line explanation (7 lines)

🔧 Subcomponents:

calculation WebSocket event listeners this.socket.onopen = () => { ... }; this.socket.onmessage = (event) => { ... }; this.socket.onerror = (error) => { ... }; this.socket.onclose = () => { ... };

Sets up four event handlers that respond to WebSocket connection, messages, errors, and disconnections

calculation Automatic reconnection setTimeout(() => { if (!this.connected && this.serverUrl) { console.log('🔄 Попытка переподключения...'); this.connect(this.serverUrl); } }, 5000);

After disconnection, waits 5 seconds then attempts to reconnect if the server URL is still set

this.socket = new WebSocket(url);
Creates a WebSocket object that establishes a two-way communication channel with the ESP32 server at the given URL
this.socket.onopen = () => { this.connected = true; ... };
When the connection opens successfully, sets connected to true and calls updateStatus() to change the green indicator in the HTML
let data = JSON.parse(event.data);
Parses the incoming message as JSON—the ESP32 sends JSON strings like {"radiation": 500, "temperature": 25, "humidity": 60}
if (data.radiation !== undefined && data.temperature !== undefined && data.humidity !== undefined) {
Checks that all three sensor readings exist before passing them to the WeatherStation
station.updateFromESP32(data.radiation, data.temperature, data.humidity);
Passes the three sensor values to WeatherStation.updateFromESP32(), which sets them as target values to animate toward
this.socket.onerror = (error) => { console.error(...); ... };
When a WebSocket error occurs, logs it to the console and marks the connection as failed
this.socket.onclose = () => { ... setTimeout(...); };
When the connection closes, waits 5 seconds then attempts to reconnect automatically—useful for recovering from temporary network interruptions

WeatherStation()

The constructor initializes all the properties that WeatherStation will use throughout its lifetime. Separating current and target values allows smooth animations; history arrays enable graphing; stats enable summary information.

class WeatherStation {
  constructor() {
    this.radiation = 0;
    this.temperature = 0;
    this.humidity = 0;
    
    this.targetRadiation = 0;
    this.targetTemperature = 0;
    this.targetHumidity = 0;
    
    this.radiationHistory = [];
    this.temperatureHistory = [];
    this.humidityHistory = [];
    this.maxHistory = 100;
    
    this.stats = {
      radiation: { min: Infinity, max: -Infinity, avg: 0 },
      temperature: { min: Infinity, max: -Infinity, avg: 0 },
      humidity: { min: Infinity, max: -Infinity, avg: 0 }
    };
    
    this.isRunning = false;
    this.mode = 'simulation';
    this.time = 0;
    this.timeScale = 1;
    
    this.updateDimensions();
  }
Line-by-line explanation (8 lines)

🔧 Subcomponents:

calculation Current vs target values this.radiation = 0; this.targetRadiation = 0;

Current values are what's displayed now; target values are what we're animating toward (from simulation or ESP32)

calculation Data history buffers this.radiationHistory = []; this.temperatureHistory = []; this.humidityHistory = []; this.maxHistory = 100;

Stores up to 100 past readings for each sensor, creating the scrolling graph effect

calculation Statistics tracker this.stats = { radiation: { min: Infinity, max: -Infinity, avg: 0 }, ... };

Tracks min/max/average for each sensor type so the info panel can display them

this.radiation = 0;
Current radiation value—what gets displayed and graphed right now
this.targetRadiation = 0;
Target radiation value—either calculated by simulation or received from ESP32, and the current value animates toward it each frame
this.radiationHistory = [];
An array that stores the last 100 radiation readings, one per update, to create the line graph
this.maxHistory = 100;
Limits the history arrays to 100 entries so the graph shows roughly the last 20 seconds of data (100 readings at 5-frame intervals)
this.stats = { ... };
An object containing min, max, and average values for each sensor type. min and max start as Infinity and -Infinity so the first real reading will become both
this.isRunning = false;
Flag that tracks whether the simulation is playing (true) or paused (false)
this.mode = 'simulation';
Controls whether sensor data comes from internal simulation ('simulation') or live ESP32 data ('esp32')
this.time = 0;
Accumulating time variable used by sine/noise functions to create realistic daily cycles in simulation mode

updateDimensions()

Called from the constructor and from windowResized(), this method calculates where on the canvas the graph should appear. It ensures responsive spacing on any canvas size.

  updateDimensions() {
    this.graphX = 50;
    this.graphY = 50;
    this.graphWidth = width - 100;
    this.graphHeight = height - 100;
  }
Line-by-line explanation (4 lines)
this.graphX = 50;
Sets the left edge of the graph 50 pixels from the left edge of the canvas, leaving margin for axis labels
this.graphY = 50;
Sets the top edge of the graph 50 pixels from the top, leaving space for title and legend
this.graphWidth = width - 100;
Graph width is the total canvas width minus 100 pixels (50 pixels on each side), so it fits with margins
this.graphHeight = height - 100;
Graph height is the total canvas height minus 100 pixels (50 pixels on top and bottom), so it fits with margins

updateFromESP32()

This simple method is called by ESP32Connection whenever a new JSON message arrives from the microcontroller. It just stores the new readings as targets; the update() method does the animation.

  updateFromESP32(radiation, temperature, humidity) {
    this.targetRadiation = radiation;
    this.targetTemperature = temperature;
    this.targetHumidity = humidity;
  }
Line-by-line explanation (3 lines)
this.targetRadiation = radiation;
Sets the target radiation to the value received from ESP32—current radiation will lerp() toward this each frame
this.targetTemperature = temperature;
Sets the target temperature to the live reading from the hardware sensor
this.targetHumidity = humidity;
Sets the target humidity to the live reading from the hardware sensor

update()

update() is the heart of the simulation. It generates or receives sensor data, smoothly animates to new values, and maintains history. The lerp() smoothing is critical—without it, ESP32 readings would jump around; with it, they flow gracefully.

🔬 The sine creates a smooth daily cycle, and the noise adds randomness on top. What happens if you change the 200 to 500 to add MORE noise (clouds)? Try 0 to remove noise and see a pure sine wave.

        let baseRadiation = map(sin(this.time * 0.5), -1, 1, 0, 1000);
        let radiationNoise = (noise(this.time * 0.1) - 0.5) * 200;

🔬 This records data every 5 frames. What happens if you change 5 to 1 (recording every frame instead) or 10 (recording half as often)? How does it affect graph smoothness?

      if (frameCount % 5 === 0) {
        this.radiationHistory.push(this.radiation);
  update() {
    if (this.isRunning) {
      if (this.mode === 'simulation') {
        this.time += deltaTime * 0.001 * this.timeScale;
        
        let baseRadiation = map(sin(this.time * 0.5), -1, 1, 0, 1000);
        let radiationNoise = (noise(this.time * 0.1) - 0.5) * 200;
        this.targetRadiation = constrain(baseRadiation + radiationNoise, 0, 1200);
        
        let baseTemp = map(this.targetRadiation, 0, 1200, 15, 35);
        let tempNoise = (noise(this.time * 0.15 + 100) - 0.5) * 5;
        this.targetTemperature = constrain(baseTemp + tempNoise, -10, 50);
        
        let baseHumidity = map(this.targetTemperature, 15, 35, 80, 30);
        let humidityNoise = (noise(this.time * 0.12 + 200) - 0.5) * 20;
        this.targetHumidity = constrain(baseHumidity + humidityNoise, 0, 100);
      }
      
      this.radiation = lerp(this.radiation, this.targetRadiation, 0.05);
      this.temperature = lerp(this.temperature, this.targetTemperature, 0.05);
      this.humidity = lerp(this.humidity, this.targetHumidity, 0.05);
      
      if (frameCount % 5 === 0) {
        this.radiationHistory.push(this.radiation);
        this.temperatureHistory.push(this.temperature);
        this.humidityHistory.push(this.humidity);
        
        if (this.radiationHistory.length > this.maxHistory) {
          this.radiationHistory.shift();
          this.temperatureHistory.shift();
          this.humidityHistory.shift();
        }
      }
      
      this.updateStats();
    }
  }
Line-by-line explanation (12 lines)

🔧 Subcomponents:

conditional Simulation mode data generation if (this.mode === 'simulation') { this.time += deltaTime * 0.001 * this.timeScale; let baseRadiation = map(sin(this.time * 0.5), -1, 1, 0, 1000); ... }

When in simulation mode, generates realistic sensor readings using sine waves and Perlin noise to create daily cycles and natural variation

calculation Smooth value animation this.radiation = lerp(this.radiation, this.targetRadiation, 0.05); this.temperature = lerp(this.temperature, this.targetTemperature, 0.05); this.humidity = lerp(this.humidity, this.targetHumidity, 0.05);

Animates current values toward their targets by 5% each frame, creating smooth transitions instead of jumpy updates

conditional History buffer management if (frameCount % 5 === 0) { this.radiationHistory.push(this.radiation); ... if (this.radiationHistory.length > this.maxHistory) { this.radiationHistory.shift(); ... } }

Every 5 frames, adds the current smoothed values to history arrays; removes the oldest values if buffer exceeds 100 entries

if (this.isRunning) {
Only runs updates if the play button has been clicked—if paused, nothing happens
this.time += deltaTime * 0.001 * this.timeScale;
Advances a time accumulator based on real elapsed time (deltaTime) and the simulation speed (timeScale). Dividing by 1000 converts milliseconds to seconds
let baseRadiation = map(sin(this.time * 0.5), -1, 1, 0, 1000);
Uses sin(time * 0.5) to create a smooth oscillation from -1 to 1, then maps that to 0–1000, simulating a daily radiation cycle that peaks at noon
let radiationNoise = (noise(this.time * 0.1) - 0.5) * 200;
Adds Perlin noise (randomness that varies smoothly) on top of the base sine wave, creating realistic cloud cover fluctuations. Subtracting 0.5 centers it around zero
this.targetRadiation = constrain(baseRadiation + radiationNoise, 0, 1200);
Combines the sine wave base and noise, then clamps the result between 0 and 1200 Watts/m² so it stays physically realistic
let baseTemp = map(this.targetRadiation, 0, 1200, 15, 35);
Temperature correlates with radiation—zero radiation → 15°C, 1200 radiation → 35°C
let baseHumidity = map(this.targetTemperature, 15, 35, 80, 30);
Humidity inversely correlates with temperature—cooler air holds more moisture, so 15°C → 80% humidity, 35°C → 30% humidity
this.radiation = lerp(this.radiation, this.targetRadiation, 0.05);
Moves current radiation 5% of the way toward the target each frame, creating smooth animated transitions instead of sudden jumps
if (frameCount % 5 === 0) {
The modulo operator % checks if frameCount is evenly divisible by 5. This runs every 5 frames, so every ~83 milliseconds at 60fps
this.radiationHistory.push(this.radiation);
Adds the current (smoothly animated) radiation value to the end of the history array
if (this.radiationHistory.length > this.maxHistory) {
Checks if the history array has grown beyond 100 entries
this.radiationHistory.shift();
Removes the oldest entry (first element) from the history array, keeping a rolling window of the last 100 readings

updateStats()

This method calculates statistics from the data history. It runs every frame but is fast because p5's min/max are optimized, and reduce() is a standard JavaScript method.

  updateStats() {
    if (this.radiationHistory.length > 0) {
      this.stats.radiation.min = min(this.radiationHistory);
      this.stats.radiation.max = max(this.radiationHistory);
      this.stats.radiation.avg = this.radiationHistory.reduce((a, b) => a + b, 0) / this.radiationHistory.length;
      
      this.stats.temperature.min = min(this.temperatureHistory);
      this.stats.temperature.max = max(this.temperatureHistory);
      this.stats.temperature.avg = this.temperatureHistory.reduce((a, b) => a + b, 0) / this.temperatureHistory.length;
      
      this.stats.humidity.min = min(this.humidityHistory);
      this.stats.humidity.max = max(this.humidityHistory);
      this.stats.humidity.avg = this.humidityHistory.reduce((a, b) => a + b, 0) / this.humidityHistory.length;
    }
  }
Line-by-line explanation (4 lines)

🔧 Subcomponents:

calculation Min/max finder this.stats.radiation.min = min(this.radiationHistory);

p5.js min() function finds the smallest value in the array

calculation Average calculation this.stats.radiation.avg = this.radiationHistory.reduce((a, b) => a + b, 0) / this.radiationHistory.length;

Uses reduce() to sum all values, then divides by count to get the average

if (this.radiationHistory.length > 0) {
Only calculates stats if there is at least one reading—prevents errors when arrays are empty
this.stats.radiation.min = min(this.radiationHistory);
p5.js min() finds the smallest number in an array. This stores it so the UI can display it
this.stats.radiation.max = max(this.radiationHistory);
p5.js max() finds the largest number in an array
this.stats.radiation.avg = this.radiationHistory.reduce((a, b) => a + b, 0) / this.radiationHistory.length;
reduce() sums all numbers (starting from 0), then dividing by length gives the average. (a, b) => a + b is a function that adds two numbers together

display()

A simple wrapper function. Currently it only calls drawGraph(), but you could add other display methods here later (e.g., drawGauge(), drawSparkline()).

  display() {
    this.drawGraph();
  }
Line-by-line explanation (1 lines)
this.drawGraph();
Calls the drawGraph() method to render all three line graphs and their axes/grid

drawGraph()

drawGraph() is the visual workhorse of the sketch. It demonstrates three key graphing techniques: (1) mapping data values to canvas coordinates with map(), (2) using beginShape/vertex/endShape to draw connected lines, and (3) layering multiple series by repeating the pattern three times with different colors. This is the foundation of data visualization in p5.js.

🔬 This draws 5 horizontal grid lines (i goes 0, 1, 2, 3, 4). What happens if you change the <= 4 to <= 9 to draw 10 lines? What if you change it to <= 2 for just 3 lines?

    for (let i = 0; i <= 4; i++) {
      let y = map(i, 0, 4, this.graphY + this.graphHeight, this.graphY);
      line(this.graphX, y, this.graphX + this.graphWidth, y);
    }

🔬 strokeWeight(3) makes the line 3 pixels thick. Try changing it to 1 for a thin line, or 8 for a thick line. What about the color (255, 111, 0)—what happens if you change it to (0, 0, 255) for blue?

    if (this.radiationHistory.length > 1) {
      noFill();
      stroke(255, 111, 0);
      strokeWeight(3);
  drawGraph() {
    push();
    
    fill(255);
    stroke(224, 224, 224);
    strokeWeight(2);
    rect(this.graphX, this.graphY, this.graphWidth, this.graphHeight, 10);
    
    fill(25, 118, 210);
    noStroke();
    textSize(16);
    textAlign(LEFT, TOP);
    text('История измерений', this.graphX, this.graphY - 30);
    
    let legendX = this.graphX + this.graphWidth - 200;
    let legendY = this.graphY + 10;
    
    fill(255, 111, 0);
    rect(legendX, legendY, 20, 3);
    fill(44, 62, 80);
    textSize(12);
    textAlign(LEFT, CENTER);
    text('Радиация (Вт/м²)', legendX + 25, legendY);
    
    fill(25, 118, 210);
    rect(legendX, legendY + 20, 20, 3);
    fill(44, 62, 80);
    text('Температура (°C)', legendX + 25, legendY + 20);
    
    fill(2, 136, 209);
    rect(legendX, legendY + 40, 20, 3);
    fill(44, 62, 80);
    text('Влажность (%)', legendX + 25, legendY + 40);
    
    stroke(224, 224, 224);
    strokeWeight(1);
    
    for (let i = 0; i <= 4; i++) {
      let y = map(i, 0, 4, this.graphY + this.graphHeight, this.graphY);
      line(this.graphX, y, this.graphX + this.graphWidth, y);
    }
    
    for (let i = 0; i <= 10; i++) {
      let x = map(i, 0, 10, this.graphX, this.graphX + this.graphWidth);
      line(x, this.graphY, x, this.graphY + this.graphHeight);
    }
    
    if (this.radiationHistory.length > 1) {
      noFill();
      stroke(255, 111, 0);
      strokeWeight(3);
      
      beginShape();
      for (let i = 0; i < this.radiationHistory.length; i++) {
        let x = map(i, 0, this.maxHistory - 1, this.graphX, this.graphX + this.graphWidth);
        let y = map(this.radiationHistory[i], 0, 1200, this.graphY + this.graphHeight, this.graphY);
        vertex(x, y);
      }
      endShape();
    }
    
    if (this.temperatureHistory.length > 1) {
      noFill();
      stroke(25, 118, 210);
      strokeWeight(3);
      
      beginShape();
      for (let i = 0; i < this.temperatureHistory.length; i++) {
        let x = map(i, 0, this.maxHistory - 1, this.graphX, this.graphX + this.graphWidth);
        let y = map(this.temperatureHistory[i], -10, 50, this.graphY + this.graphHeight, this.graphY);
        vertex(x, y);
      }
      endShape();
    }
    
    if (this.humidityHistory.length > 1) {
      noFill();
      stroke(2, 136, 209);
      strokeWeight(3);
      
      beginShape();
      for (let i = 0; i < this.humidityHistory.length; i++) {
        let x = map(i, 0, this.maxHistory - 1, this.graphX, this.graphX + this.graphWidth);
        let y = map(this.humidityHistory[i], 0, 100, this.graphY + this.graphHeight, this.graphY);
        vertex(x, y);
      }
      endShape();
    }
    
    pop();
  }
Line-by-line explanation (14 lines)

🔧 Subcomponents:

calculation Graph background box fill(255); stroke(224, 224, 224); strokeWeight(2); rect(this.graphX, this.graphY, this.graphWidth, this.graphHeight, 10);

Draws a white rounded rectangle that is the background of the graph area

for-loop Horizontal and vertical grid for (let i = 0; i <= 4; i++) { let y = map(i, 0, 4, this.graphY + this.graphHeight, this.graphY); line(this.graphX, y, this.graphX + this.graphWidth, y); } for (let i = 0; i <= 10; i++) { let x = map(i, 0, 10, this.graphX, this.graphX + this.graphWidth); line(x, this.graphY, x, this.graphY + this.graphHeight); }

Draws 5 horizontal lines and 11 vertical lines to create a grid that helps read values off the graph

calculation Radiation line graph if (this.radiationHistory.length > 1) { noFill(); stroke(255, 111, 0); strokeWeight(3); beginShape(); for (let i = 0; i < this.radiationHistory.length; i++) { let x = map(i, 0, this.maxHistory - 1, this.graphX, this.graphX + this.graphWidth); let y = map(this.radiationHistory[i], 0, 1200, this.graphY + this.graphHeight, this.graphY); vertex(x, y); } endShape(); }

Draws an orange line connecting all radiation history points, using map() to convert data values to canvas coordinates

push();
Saves the current drawing settings (color, stroke, etc.) so changes made in this function don't affect code after pop()
fill(255);
Sets fill color to white (RGB: 255, 255, 255)
rect(this.graphX, this.graphY, this.graphWidth, this.graphHeight, 10);
Draws a rounded rectangle (the 10 is the corner radius) that serves as the background of the graph
text('История измерений', this.graphX, this.graphY - 30);
Draws the title 'History of Measurements' 30 pixels above the graph
let legendX = this.graphX + this.graphWidth - 200;
Positions the legend 200 pixels from the right edge of the graph, so it appears in the upper right
fill(255, 111, 0); rect(legendX, legendY, 20, 3);
Draws a small orange rectangle (20 wide, 3 tall) next to the legend text to show which line is radiation
for (let i = 0; i <= 4; i++) {
Loops 5 times (i = 0, 1, 2, 3, 4) to draw 5 horizontal grid lines evenly spaced from bottom to top
let y = map(i, 0, 4, this.graphY + this.graphHeight, this.graphY);
Maps i (0-4) to y-coordinates on canvas: i=0 maps to bottom, i=4 maps to top. Note: canvas y increases downward
for (let i = 0; i < this.radiationHistory.length; i++) {
Loops through each radiation reading stored in the history array
let x = map(i, 0, this.maxHistory - 1, this.graphX, this.graphX + this.graphWidth);
Maps the array index (0 to 99) to x-coordinates: first reading appears at left edge, last reading appears at right edge
let y = map(this.radiationHistory[i], 0, 1200, this.graphY + this.graphHeight, this.graphY);
Maps the radiation value (0-1200) to y-coordinates: 0 appears at bottom, 1200 appears at top
vertex(x, y);
Adds this (x, y) point as a vertex in the shape being drawn. When called 100 times with connected points, creates a line graph
endShape();
Finishes drawing the shape, connecting all the vertices with lines in the currently set stroke color
pop();
Restores the drawing settings that were saved at the beginning of the function

start()

A simple setter. Called when the play button is clicked. The opposite is stop().

  start() {
    this.isRunning = true;
  }
Line-by-line explanation (1 lines)
this.isRunning = true;
Sets the flag to true, which causes update() to begin simulating or receiving data each frame

stop()

Pauses all updates without losing data. Called when the play button is clicked again to toggle play/pause.

  stop() {
    this.isRunning = false;
  }
Line-by-line explanation (1 lines)
this.isRunning = false;
Sets the flag to false, pausing the simulation and data updates

reset()

Called when the reset button is clicked. Clears all data and statistics so you can start a fresh measurement session.

  reset() {
    this.radiation = 0;
    this.temperature = 0;
    this.humidity = 0;
    this.targetRadiation = 0;
    this.targetTemperature = 0;
    this.targetHumidity = 0;
    this.radiationHistory = [];
    this.temperatureHistory = [];
    this.humidityHistory = [];
    this.time = 0;
    this.stats = {
      radiation: { min: Infinity, max: -Infinity, avg: 0 },
      temperature: { min: Infinity, max: -Infinity, avg: 0 },
      humidity: { min: Infinity, max: -Infinity, avg: 0 }
    };
  }
Line-by-line explanation (4 lines)
this.radiation = 0;
Clears the current radiation value
this.radiationHistory = [];
Empties the history array so the graph clears
this.time = 0;
Resets the simulation clock so a new day cycle begins from the start
this.stats = { ... };
Resets all statistics to their initial state (min and max back to Infinity and -Infinity)

GUI()

The GUI constructor orchestrates the creation of all HTML UI elements. It's a good example of separating concerns—one class for p5 graphing, one for hardware communication, one for DOM manipulation.

class GUI {
  constructor() {
    this.esp32 = new ESP32Connection();
    this.createControls();
    this.createMainDisplay();
    this.createInfoPanel();
  }
Line-by-line explanation (4 lines)

🔧 Subcomponents:

calculation GUI setup this.esp32 = new ESP32Connection(); this.createControls(); this.createMainDisplay(); this.createInfoPanel();

Initializes the WebSocket connection object and calls three helper methods to build the UI

this.esp32 = new ESP32Connection();
Creates a new ESP32Connection object that manages the WebSocket connection
this.createControls();
Builds the play/stop button, reset button, mode selector, and speed selector
this.createMainDisplay();
Builds the three large sensor cards (radiation, temperature, humidity) that show live values
this.createInfoPanel();
Builds the statistics panel showing min/max/average for each sensor

createControls()

This method demonstrates p5.js DOM creation: createButton(), createSelect(), createElement() for building interactive HTML controls entirely in JavaScript. The callback functions (mousePressed, changed) connect UI interactions to data changes.

  createControls() {
    let controlsDiv = select('#controls');
    
    this.startBtn = createButton('▶ Старт');
    this.startBtn.parent(controlsDiv);
    this.startBtn.mousePressed(() => {
      if (station.isRunning) {
        station.stop();
        this.startBtn.html('▶ Старт');
        this.startBtn.removeClass('active');
      } else {
        station.start();
        this.startBtn.html('⏸ Стоп');
        this.startBtn.addClass('active');
      }
    });
    
    this.resetBtn = createButton('🔄 Сброс');
    this.resetBtn.parent(controlsDiv);
    this.resetBtn.mousePressed(() => {
      station.reset();
      station.stop();
      this.startBtn.html('▶ Старт');
      this.startBtn.removeClass('active');
    });
    
    let modeGroup = createDiv('');
    modeGroup.parent(controlsDiv);
    modeGroup.class('control-group');
    
    let modeLabel = createElement('label', 'Режим:');
    modeLabel.parent(modeGroup);
    
    this.modeSelect = createSelect();
    this.modeSelect.parent(modeGroup);
    this.modeSelect.option('Симуляция', 'simulation');
    this.modeSelect.option('ESP32', 'esp32');
    this.modeSelect.changed(() => {
      station.mode = this.modeSelect.value();
      if (station.mode === 'esp32') {
        this.showConnectionDialog();
      }
    });
    
    let speedGroup = createDiv('');
    speedGroup.parent(controlsDiv);
    speedGroup.class('control-group');
    
    let speedLabel = createElement('label', 'Скорость:');
    speedLabel.parent(speedGroup);
    
    this.speedSelect = createSelect();
    this.speedSelect.parent(speedGroup);
    this.speedSelect.option('0.5x', '0.5');
    this.speedSelect.option('1x', '1');
    this.speedSelect.option('2x', '2');
    this.speedSelect.option('5x', '5');
    this.speedSelect.selected('1');
    this.speedSelect.changed(() => {
      station.timeScale = parseFloat(this.speedSelect.value());
    });
  }
Line-by-line explanation (12 lines)

🔧 Subcomponents:

calculation Play/stop toggle this.startBtn = createButton('▶ Старт'); this.startBtn.parent(controlsDiv); this.startBtn.mousePressed(() => { ... });

Creates a button that toggles between start and stop, updating its label and style accordingly

calculation Simulation vs ESP32 mode this.modeSelect = createSelect(); this.modeSelect.option('Симуляция', 'simulation'); this.modeSelect.option('ESP32', 'esp32'); this.modeSelect.changed(() => { ... });

Creates a dropdown menu that switches between simulated data and live ESP32 data

calculation Simulation speed control this.speedSelect = createSelect(); this.speedSelect.option('0.5x', '0.5'); this.speedSelect.option('1x', '1'); this.speedSelect.option('2x', '2'); this.speedSelect.option('5x', '5');

Dropdown to control how fast the simulation runs relative to real time

let controlsDiv = select('#controls');
Uses p5.js select() to find the HTML element with id 'controls' and store a reference to it
this.startBtn = createButton('▶ Старт');
Creates a button with the label '▶ Start' (in Russian). Stores it in a property so we can access it later
this.startBtn.parent(controlsDiv);
Tells p5.js to place this button inside the #controls div in the HTML
this.startBtn.mousePressed(() => {
Registers a callback function that runs whenever the button is clicked
if (station.isRunning) {
Checks whether the simulation is currently running
this.startBtn.html('▶ Старт');
Changes the button's label back to 'Start'
this.startBtn.addClass('active');
Adds a CSS class 'active' to the button so it appears visually highlighted (green background from style.css)
this.modeSelect = createSelect();
Creates a dropdown menu that users can click to select options
this.modeSelect.option('Симуляция', 'simulation');
Adds an option to the dropdown. The first argument is display text, second is the internal value
this.modeSelect.changed(() => { ... });
Registers a callback that runs whenever the user selects a different option
station.mode = this.modeSelect.value();
Updates the WeatherStation's mode to the selected value ('simulation' or 'esp32')
station.timeScale = parseFloat(this.speedSelect.value());
Converts the speed dropdown's string value ('1', '2', etc.) to a number and sets it as the timeScale

showConnectionDialog()

A simple dialog handler. Uses the browser's built-in prompt() to ask the user for input. If they cancel, we revert to simulation mode.

  showConnectionDialog() {
    let url = prompt('Введите адрес ESP32 WebSocket\n(например: ws://192.168.1.100:81)', 'ws://192.168.1.100:81');
    if (url) {
      this.esp32.connect(url);
    } else {
      this.modeSelect.selected('simulation');
      station.mode = 'simulation';
    }
  }
Line-by-line explanation (5 lines)
let url = prompt('Введите адрес ESP32 WebSocket\n(например: ws://192.168.1.100:81)', 'ws://192.168.1.100:81');
Shows a browser prompt dialog asking the user to enter a WebSocket URL. The second argument is the default text ('ws://192.168.1.100:81')
if (url) {
If the user entered something (didn't cancel), url will be a string
this.esp32.connect(url);
Calls ESP32Connection.connect() with the URL the user entered, initiating the WebSocket connection
} else {
If the user clicked Cancel, url will be null or empty
this.modeSelect.selected('simulation');
Reverts the mode dropdown back to 'simulation' since the ESP32 connection was not attempted

createMainDisplay()

A layout builder that creates three identical cards by calling createSensorCard() three times with different parameters. This demonstrates the DRY (Don't Repeat Yourself) principle.

  createMainDisplay() {
    let displayDiv = select('#main-display');
    
    this.radiationCard = this.createSensorCard(
      '☀️',
      'Солнечная радиация',
      '0.0',
      'Вт/м²',
      'radiation'
    );
    this.radiationCard.parent(displayDiv);
    
    this.temperatureCard = this.createSensorCard(
      '🌡️',
      'Температура',
      '0.0',
      '°C',
      'temperature'
    );
    this.temperatureCard.parent(displayDiv);
    
    this.humidityCard = this.createSensorCard(
      '💧',
      'Влажность',
      '0.0',
      '%',
      'humidity'
    );
    this.humidityCard.parent(displayDiv);
  }
Line-by-line explanation (3 lines)

🔧 Subcomponents:

calculation Three sensor cards this.radiationCard = this.createSensorCard(...); this.temperatureCard = this.createSensorCard(...); this.humidityCard = this.createSensorCard(...);

Creates three identical cards with different icons, labels, and units

let displayDiv = select('#main-display');
Finds the #main-display div in the HTML where sensor cards will be placed
this.radiationCard = this.createSensorCard(...);
Calls createSensorCard() with parameters for the radiation sensor—emoji, label, initial value, unit, and CSS class name
this.radiationCard.parent(displayDiv);
Places the created card inside the displayDiv

createSensorCard()

A factory function that creates reusable DOM elements. By storing card.valueEl, we avoid rebuilding the entire card every frame—just update the text content.

  createSensorCard(icon, label, value, unit, type) {
    let card = createDiv('');
    card.class('sensor-card');
    card.class(type);
    
    let iconEl = createDiv(icon);
    iconEl.class('icon');
    iconEl.parent(card);
    
    let labelEl = createDiv(label);
    labelEl.class('label');
    labelEl.parent(card);
    
    let valueEl = createDiv(value);
    valueEl.class('value');
    valueEl.parent(card);
    card.valueEl = valueEl;
    
    let unitEl = createDiv(unit);
    unitEl.class('unit');
    unitEl.parent(card);
    
    return card;
  }
Line-by-line explanation (5 lines)
let card = createDiv('');
Creates an empty div that will be the container for all card elements
card.class('sensor-card');
Adds the CSS class 'sensor-card' which styles the card (background, border, padding from style.css)
card.class(type);
Adds a second class ('radiation', 'temperature', or 'humidity') for type-specific styling (different colors)
card.valueEl = valueEl;
Stores a reference to the value element so GUI.update() can change it later without rebuilding the card
return card;
Returns the fully constructed card so it can be stored and later added to the display

createInfoPanel()

This method creates a statistics dashboard with 9 stat items (min/max/avg for each of 3 sensor types). It demonstrates scaling a component: one helper function (createStatItem) is called 9 times with different labels.

  createInfoPanel() {
    let infoDiv = select('#info-panel');
    
    let title = createElement('div', 'Статистика измерений');
    title.class('info-title');
    title.parent(infoDiv);
    
    let statsGrid = createDiv('');
    statsGrid.class('stats-grid');
    statsGrid.parent(infoDiv);
    
    this.radMinStat = this.createStatItem('Мин. радиация', '0.0', 'Вт/м²', 'radiation-stat');
    this.radMinStat.parent(statsGrid);
    
    this.radMaxStat = this.createStatItem('Макс. радиация', '0.0', 'Вт/м²', 'radiation-stat');
    this.radMaxStat.parent(statsGrid);
    
    this.radAvgStat = this.createStatItem('Средн. радиация', '0.0', 'Вт/м²', 'radiation-stat');
    this.radAvgStat.parent(statsGrid);
    
    this.tempMinStat = this.createStatItem('Мин. температура', '0.0', '°C', 'temperature-stat');
    this.tempMinStat.parent(statsGrid);
    
    this.tempMaxStat = this.createStatItem('Макс. температура', '0.0', '°C', 'temperature-stat');
    this.tempMaxStat.parent(statsGrid);
    
    this.tempAvgStat = this.createStatItem('Средн. температура', '0.0', '°C', 'temperature-stat');
    this.tempAvgStat.parent(statsGrid);
    
    this.humMinStat = this.createStatItem('Мин. влажность', '0.0', '%', 'humidity-stat');
    this.humMinStat.parent(statsGrid);
    
    this.humMaxStat = this.createStatItem('Макс. влажность', '0.0', '%', 'humidity-stat');
    this.humMaxStat.parent(statsGrid);
    
    this.humAvgStat = this.createStatItem('Средн. влажность', '0.0', '%', 'humidity-stat');
    this.humAvgStat.parent(statsGrid);
  }
Line-by-line explanation (4 lines)

🔧 Subcomponents:

calculation 9 statistics items this.radMinStat = this.createStatItem(...); this.radMaxStat = this.createStatItem(...); ... (9 total)

Creates a 3×3 grid of min/max/average values for radiation, temperature, and humidity

let infoDiv = select('#info-panel');
Finds the #info-panel div in the HTML where statistics will be displayed
let title = createElement('div', 'Статистика измерений');
Creates a div containing the text 'Statistics of Measurements' as a section header
let statsGrid = createDiv(''); statsGrid.class('stats-grid');
Creates an empty div with class 'stats-grid', which is styled as a CSS Grid layout to arrange 9 items in 3 columns
this.radMinStat = this.createStatItem('Мин. радиация', '0.0', 'Вт/м²', 'radiation-stat');
Creates a stat item for minimum radiation and stores it so update() can change the value later

createStatItem()

Similar to createSensorCard(), this is a reusable factory function. By storing item.valueEl, we make updates fast and efficient.

  createStatItem(title, value, unit, type) {
    let item = createDiv('');
    item.class('stat-item');
    item.class(type);
    
    let titleEl = createElement('h3', title);
    titleEl.parent(item);
    
    let valueEl = createDiv(value);
    valueEl.class('stat-value');
    valueEl.parent(item);
    item.valueEl = valueEl;
    
    let unitEl = createDiv(unit);
    unitEl.class('stat-unit');
    unitEl.parent(item);
    
    return item;
  }
Line-by-line explanation (4 lines)
let item = createDiv('');
Creates the container div for one statistic
item.class('stat-item');
Adds base styling (padding, border, etc.) shared by all stat items
item.class(type);
Adds type-specific styling ('radiation-stat', 'temperature-stat', or 'humidity-stat') for color coding
item.valueEl = valueEl;
Stores a reference so update() can quickly change the number without rebuilding the entire element

GUI.update()

Called every frame from draw(). This is the most efficient way to update DOM text: only change the text content, don't rebuild the entire DOM. The stored references (card.valueEl) make this fast and clean.

  update() {
    this.radiationCard.valueEl.html(station.radiation.toFixed(1));
    this.temperatureCard.valueEl.html(station.temperature.toFixed(1));
    this.humidityCard.valueEl.html(station.humidity.toFixed(1));
    
    if (station.radiationHistory.length > 0) {
      this.radMinStat.valueEl.html(station.stats.radiation.min.toFixed(1));
      this.radMaxStat.valueEl.html(station.stats.radiation.max.toFixed(1));
      this.radAvgStat.valueEl.html(station.stats.radiation.avg.toFixed(1));
      
      this.tempMinStat.valueEl.html(station.stats.temperature.min.toFixed(1));
      this.tempMaxStat.valueEl.html(station.stats.temperature.max.toFixed(1));
      this.tempAvgStat.valueEl.html(station.stats.temperature.avg.toFixed(1));
      
      this.humMinStat.valueEl.html(station.stats.humidity.min.toFixed(1));
      this.humMaxStat.valueEl.html(station.stats.humidity.max.toFixed(1));
      this.humAvgStat.valueEl.html(station.stats.humidity.avg.toFixed(1));
    }
  }
Line-by-line explanation (4 lines)

🔧 Subcomponents:

calculation Main display refresh this.radiationCard.valueEl.html(station.radiation.toFixed(1)); this.temperatureCard.valueEl.html(station.temperature.toFixed(1)); this.humidityCard.valueEl.html(station.humidity.toFixed(1));

Updates the three large sensor values on the main display

conditional Statistics panel refresh if (station.radiationHistory.length > 0) { ... }

Updates all 9 statistics values only if data has been recorded

this.radiationCard.valueEl.html(station.radiation.toFixed(1));
Reads the current radiation from the WeatherStation, formats it to 1 decimal place, and sets it as the HTML of the radiation card's value element
.toFixed(1)
A JavaScript string method that rounds a number to 1 decimal place and returns it as a string ('25.3', '100.0', etc.)
if (station.radiationHistory.length > 0) {
Only updates statistics if there is at least one reading in history—prevents displaying Infinity before data arrives
this.radMinStat.valueEl.html(station.stats.radiation.min.toFixed(1));
Reads the minimum radiation value from WeatherStation.stats and displays it

📦 Key Variables

station object (WeatherStation)

Global instance managing all sensor data, simulation, and graphing logic

let station;
gui object (GUI)

Global instance managing all HTML buttons, dropdowns, sensor cards, and statistics display

let gui;
radiation, targetRadiation number

Current and target radiation values (Watts per square meter). Current animates toward target each frame

this.radiation = 0; this.targetRadiation = 0;
radiationHistory, temperatureHistory, humidityHistory array of numbers

Stores the last 100 sensor readings for each type, used to draw the three line graphs

this.radiationHistory = [];
stats object

Tracks min, max, and average values for each sensor type across all recorded history

this.stats = { radiation: { min: Infinity, max: -Infinity, avg: 0 }, ... }
isRunning boolean

Flag indicating whether the simulation is playing (true) or paused (false)

this.isRunning = false;
mode string

Controls whether sensor data comes from internal simulation ('simulation') or live ESP32 ('esp32')

this.mode = 'simulation';
time, timeScale number

this.time = 0; this.timeScale = 1;
graphX, graphY, graphWidth, graphHeight number

Pixel coordinates and dimensions defining where the graph is drawn on the canvas

this.graphX = 50; this.graphY = 50; this.graphWidth = width - 100; this.graphHeight = height - 100;
socket, connected, serverUrl WebSocket / boolean / string

WebSocket object and connection state for ESP32 communication

this.socket = null; this.connected = false; this.serverUrl = '';

🔧 Potential Improvements (5)

Here are some ways this code could be enhanced:

PERFORMANCE WeatherStation.updateStats()

Calling min() and max() on the same array twice per sensor (once in updateStats, possibly again during rendering) wastes computation. Arrays aren't indexed, so finding min/max is O(n) every frame.

💡 Cache min/max values and update them incrementally. When a new value is added to history: if (newVal < stats.radiation.min) stats.radiation.min = newVal. When the oldest value is removed, scan once to recalculate if it was the min/max.

BUG ESP32Connection.connect() auto-reconnect

If the user manually switches back to simulation mode while auto-reconnect is waiting, the setTimeout will still try to reconnect 5 seconds later, potentially overwriting the mode.

💡 Add a check in the setTimeout callback: if (station.mode !== 'esp32') return; to prevent reconnecting when the user isn't in ESP32 mode anymore.

STYLE drawGraph() - three separate line-drawing blocks

The code for drawing radiation, temperature, and humidity lines is nearly identical, violating DRY. Maintenance requires updating three places.

💡 Create a helper method drawSeries(historyArray, minVal, maxVal, color) that draws one series, then call it three times with different parameters.

FEATURE WeatherStation simulation

The simulation uses fixed ranges (radiation 0–1200, temperature -10 to 50) which may not match real sensor data or units.

💡 Add configurable min/max properties (simulationRadiationMax, simulationTempMin, simulationTempMax) so users can adjust ranges to their location or sensor specs without editing code.

BUG drawGraph() line drawing

If the history array has fewer points than expected (e.g., after reset(), only 10 readings exist), the map() still scales i from 0 to maxHistory-1 (0-99), causing points to bunch on the left side of the graph.

💡 Change 'map(i, 0, this.maxHistory - 1, ...)' to 'map(i, 0, this.radiationHistory.length - 1, ...)' so the scale adapts to the actual number of points.

🔄 Code Flow

Code flow showing setup, draw, windowresized, esp32connection, weatherstation, updatedimensions, updatefromesp32, update, updatestats, display, drawgraph, start, stop, reset, gui, createcontrols, showconnectiondialog, createmaindisplay, createsensorcard, createinfopanel, createstatitem, guiupdate

💡 Click on function names in the diagram to jump to their code

graph TD start[Start] --> setup[setup] setup --> canvas-creation[canvas-creation] setup --> class-instantiation[class-instantiation] setup --> gui-initialization[gui-initialization] setup --> draw[draw loop] click setup href "#fn-setup" click canvas-creation href "#sub-canvas-creation" click class-instantiation href "#sub-class-instantiation" click gui-initialization href "#sub-gui-initialization" click draw href "#fn-draw" draw --> background-clear[background-clear] draw --> station-update[station-update] draw --> gui-update[gui-update] click background-clear href "#sub-background-clear" click station-update href "#sub-station-update" click gui-update href "#sub-gui-update" station-update --> socket-handlers[socket-handlers] station-update --> value-pairs[value-pairs] station-update --> history-arrays[history-arrays] station-update --> stats-object[stats-object] station-update --> simulation-branch[simulation-branch] station-update --> lerp-animation[lerp-animation] station-update --> history-recording[history-recording] click socket-handlers href "#sub-socket-handlers" click value-pairs href "#sub-value-pairs" click history-arrays href "#sub-history-arrays" click stats-object href "#sub-stats-object" click simulation-branch href "#sub-simulation-branch" click lerp-animation href "#sub-lerp-animation" click history-recording href "#sub-history-recording" gui-update --> sensor-cards-update[sensor-cards-update] gui-update --> statistics-update[statistics-update] click sensor-cards-update href "#sub-sensor-cards-update" click statistics-update href "#sub-statistics-update" windowresized[windowresized] --> canvas-resize[canvas-resize] windowresized --> dimension-update[dimension-update] click windowresized href "#fn-windowresized" click canvas-resize href "#sub-canvas-resize" click dimension-update href "#sub-dimension-update" gui --> createcontrols[createcontrols] gui --> createmaindisplay[createmaindisplay] gui --> createinfopanel[createinfopanel] click gui href "#fn-gui" click createcontrols href "#sub-createcontrols" click createmaindisplay href "#sub-createmaindisplay" click createinfopanel href "#sub-createinfopanel" createmaindisplay --> createsensorcard[createsensorcard] click createsensorcard href "#sub-createsensorcard" createinfopanel --> createstatitem[createstatitem] click createstatitem href "#sub-createstatitem" start --> play-stop-button[play-stop-button] start --> mode-selector[mode-selector] start --> speed-selector[speed-selector] click play-stop-button href "#sub-play-stop-button" click mode-selector href "#sub-mode-selector" click speed-selector href "#sub-speed-selector"

❓ Frequently Asked Questions

What visual elements does the aktinometr sketch display?

The aktinometr sketch visually represents environmental data such as solar radiation, temperature, and humidity using dynamic graphics that update in real-time.

How can users interact with the aktinometr sketch?

Users can interact with the aktinometr sketch through a graphical user interface (GUI) that allows them to monitor and visualize the environmental data collected from an ESP32 connection.

What creative coding concepts are demonstrated in the aktinometr sketch?

The aktinometr sketch demonstrates the use of WebSocket connections for real-time data streaming and dynamic visualization techniques in p5.js to represent environmental monitoring.

Preview

aktinometr - p5.js creative coding sketch preview
Sketch Preview
Code flow diagram showing the structure of aktinometr - Code flow showing setup, draw, windowresized, esp32connection, weatherstation, updatedimensions, updatefromesp32, update, updatestats, display, drawgraph, start, stop, reset, gui, createcontrols, showconnectiondialog, createmaindisplay, createsensorcard, createinfopanel, createstatitem, guiupdate
Code Flow Diagram