
aktinometr (Remix)

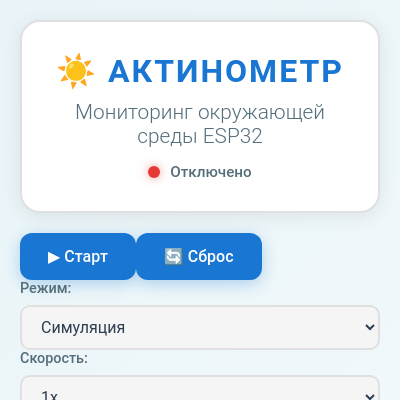
This sketch creates an interactive weather station dashboard that displays real-time sensor data for solar radiation, temperature, and humidity. The visualization combines animated sensor cards with a multi-line graph showing measurement history, and supports both simulated data and live ESP32 hardware connections via WebSocket.

🧪 Try This!

Experiment with the code by making these changes:

  1. Speed up the simulation — Change the time increment to make the sine wave cycle faster - the radiation will oscillate in shorter periods
  2. Increase noise variation — Higher noise multiplier makes fluctuations more extreme and less smooth - try 500 or 1000 for chaotic readings
  3. Make the graph update faster — Lower the frame count divisor so history appends more frequently, creating denser graph lines
  4. Smooth out the animation — Decrease the lerp factor to slow down how fast current values chase targets - try 0.01 for creeping movement
  5. Reverse the temperature scale — Swap the temperature range mapping so cold shows at top and hot at bottom - creates inverted visualization
  6. Remove temperature-radiation correlation — Delete the correlation so temperature varies independently instead of following radiation
Prefer the full editor? Open it there →

📖 About This Sketch

This sketch builds a complete weather station interface that monitors three key environmental metrics: solar radiation, temperature, and humidity. The visualization combines smooth animated cards displaying current readings with a multi-line graph that plots the history of all three measurements over time. It teaches multiple advanced p5.js concepts including the draw loop for continuous updates, the map() function for scaling data to screen coordinates, beginShape/endShape for drawing connected line graphs, and integration with HTML DOM elements through p5.js's createDiv, createButton, and select functions.

The code is organized into three main classes: WeatherStation manages the sensor data and graph display, ESP32Connection handles WebSocket communication with hardware, and GUI creates and updates the interactive dashboard. By studying this sketch, you will learn how to structure complex interactive visualizations, manage real-time data with arrays and history buffers, perform smooth numerical interpolation with lerp(), calculate statistics from data collections, and bridge p5.js canvas graphics with HTML DOM controls and external hardware connections.

⚙️ How It Works

  1. When setup() runs, it creates a responsive canvas container and instantiates a WeatherStation object to hold all sensor data and a GUI object to build the interactive interface with buttons, dropdowns, sensor cards, and statistics display.
  2. The draw() function calls station.update() to either simulate realistic environmental data (using sine waves, Perlin noise, and mathematical relationships) or receive live data from an ESP32 via WebSocket, then uses lerp() to smoothly interpolate current values toward targets.
  3. Every five frames, the current readings are appended to history arrays (radiationHistory, temperatureHistory, humidityHistory) up to a maximum of 100 data points, creating a rolling window of recent measurements.
  4. The drawGraph() method renders three overlaid line graphs using beginShape/endShape, mapping each data value to pixel coordinates on the canvas with different color-coded lines for each metric and a grid backdrop.
  5. The GUI.update() method runs every frame to refresh the animated sensor cards and statistics display by reading station properties and formatting them with toFixed() for clean decimal display.
  6. When users click buttons or change dropdowns, event handlers modify station properties (start/stop, reset data, change simulation speed) or trigger the showConnectionDialog() to connect to external hardware.

🎓 Concepts You'll Learn

Animation with lerp()Data visualization with beginShape/endShapeArray history buffersMap function for scalingWebSocket communicationDOM integration with p5.jsStatistics calculationPerlin noise for simulation

📝 Code Breakdown

setup()

setup() runs once when the sketch loads. It initializes the canvas size, places it in the DOM, and creates the two main objects that power the entire sketch. The responsive sizing pattern using min() and windowWidth makes this sketch adapt to different screen sizes.

function setup() {
  let canvas = createCanvas(min(windowWidth - 40, 1200), 400);
  canvas.parent('canvas-container');
  
  station = new WeatherStation();
  gui = new GUI();
  
  // textFont('Roboto'); // Roboto is loaded via CSS, this should work fine for 2D canvas.
}
Line-by-line explanation (4 lines)
let canvas = createCanvas(min(windowWidth - 40, 1200), 400);
Creates a canvas that is either 40 pixels narrower than the window or 1200 pixels wide (whichever is smaller), with a fixed height of 400 pixels - this responsive sizing ensures the sketch looks good on phones and large monitors
canvas.parent('canvas-container');
Tells p5.js to place the canvas inside the HTML div with id 'canvas-container' instead of at the top of the page
station = new WeatherStation();
Creates the main sensor data manager object that will store all readings, history, and statistics
gui = new GUI();
Creates the interactive interface object that builds buttons, dropdowns, sensor cards, and the statistics panel
draw()

draw() runs 60 times per second, executing this four-line sequence continuously. This is where all animation and real-time updates happen - station.update() fetches or simulates new data, station.display() renders it, and gui.update() keeps the dashboard current.

function draw() {
  background(245, 248, 250);
  
  station.update();
  station.display();
  
  gui.update();
}
Line-by-line explanation (4 lines)
background(245, 248, 250);
Fills the entire canvas with a light blue-gray color (RGB values), erasing everything drawn in the previous frame
station.update();
Updates the simulation or receives new ESP32 data, smoothly interpolates current readings toward targets, and appends new values to the history arrays
station.display();
Calls drawGraph() to render the multi-line graph with all three sensor readings plotted as connected lines
gui.update();
Refreshes the animated sensor cards and statistics display on the right side by reading current station values

windowResized()

windowResized() is a special p5.js function that automatically runs whenever the browser window changes size. This ensures the sketch remains responsive - the graph and canvas adjust smoothly when you resize your browser or rotate your phone.

function windowResized() {
  resizeCanvas(min(windowWidth - 40, 1200), 400);
  station.updateDimensions();
}
Line-by-line explanation (2 lines)
resizeCanvas(min(windowWidth - 40, 1200), 400);
Adjusts the canvas size when the browser window is resized, maintaining the same responsive logic as setup()
station.updateDimensions();
Recalculates the graph's position and dimensions based on the new canvas size so it still fits properly

ESP32Connection

This class handles all WebSocket communication with external ESP32 hardware. WebSockets enable continuous two-way communication - the ESP32 sends sensor readings in JSON format, this code parses them, and passes them to the WeatherStation for display. The auto-reconnect feature makes the sketch resilient to network interruptions.

class ESP32Connection {
  constructor() {
    this.socket = null;
    this.connected = false;
    this.serverUrl = '';
  }
  
  connect(url) {
    try {
      this.serverUrl = url;
      this.socket = new WebSocket(url);
      
      this.socket.onopen = () => {
        this.connected = true;
        console.log('✅ Подключено к ESP32');
        this.updateStatus(true);
      };
      
      this.socket.onmessage = (event) => {
        try {
          let data = JSON.parse(event.data);
          if (data.radiation !== undefined && data.temperature !== undefined && data.humidity !== undefined) {
            station.updateFromESP32(data.radiation, data.temperature, data.humidity);
          }
        } catch (e) {
          console.error('Ошибка парсинга данных:', e);
        }
      };
      
      this.socket.onerror = (error) => {
        console.error('❌ Ошибка WebSocket:', error);
        this.connected = false;
        this.updateStatus(false);
      };
      
      this.socket.onclose = () => {
        this.connected = false;
        console.log('🔌 Отключено от ESP32');
        this.updateStatus(false);
        
        // Автоматическое переподключение через 5 секунд
        setTimeout(() => {
          if (!this.connected && this.serverUrl) {
            console.log('🔄 Попытка переподключения...');
            this.connect(this.serverUrl);
          }
        }, 5000);
      };
      
    } catch (e) {
      console.error('Ошибка подключения:', e);
      this.connected = false;
      this.updateStatus(false);
    }
  }
  
  disconnect() {
    if (this.socket) {
      this.socket.close();
      this.socket = null;
      this.connected = false;
      this.serverUrl = '';
      this.updateStatus(false);
    }
  }
  
  updateStatus(connected) {
    let indicator = document.querySelector('.status-indicator');
    let text = document.querySelector('.status-text');
    
    if (indicator && text) {
      if (connected) {
        indicator.classList.add('connected');
        text.textContent = 'Подключено к ESP32';
      } else {
        indicator.classList.remove('connected');
        text.textContent = 'Отключено';
      }
    }
  }
}
Line-by-line explanation (6 lines)

🔧 Subcomponents:

method connect() WebSocket Setup this.socket = new WebSocket(url);

Establishes a WebSocket connection to an ESP32 device and sets up event handlers for open, message, error, and close events

conditional Message Parser if (data.radiation !== undefined && data.temperature !== undefined && data.humidity !== undefined)

Validates that incoming JSON data contains all three required sensor values before updating the station

calculation Auto-Reconnect setTimeout(() => { if (!this.connected && this.serverUrl) { this.connect(this.serverUrl); } }, 5000);

Automatically attempts to reconnect to the ESP32 after 5 seconds if the connection drops

this.socket = new WebSocket(url);
Creates a WebSocket connection object - this is the communication channel between your browser and the ESP32 device
this.socket.onopen = () => { this.connected = true; ... }
Defines what happens when the connection succeeds - sets connected to true and updates the status indicator
let data = JSON.parse(event.data);
Converts the incoming message from text (JSON format) into a JavaScript object so you can access radiation, temperature, and humidity properties
if (data.radiation !== undefined && data.temperature !== undefined && data.humidity !== undefined)
Checks that all three sensor values are present before using them - this prevents crashes from incomplete data
station.updateFromESP32(data.radiation, data.temperature, data.humidity);
Passes the parsed sensor values to the WeatherStation to update the target values for smooth interpolation
setTimeout(() => { if (!this.connected && this.serverUrl) { this.connect(this.serverUrl); } }, 5000);
Schedules an automatic reconnection attempt 5 seconds after disconnect - ensures the sketch tries to recover from network hiccups

WeatherStation

The constructor initializes all properties that track sensor readings, history, and simulation state. The separation of 'current' vs 'target' values enables smooth animation - you can jump target values instantly while current values interpolate smoothly toward them.

class WeatherStation {
  constructor() {
    // Текущие показания
    this.radiation = 0;
    this.temperature = 0;
    this.humidity = 0;
    
    // Целевые значения
    this.targetRadiation = 0;
    this.targetTemperature = 0;
    this.targetHumidity = 0;
    
    // История данных
    this.radiationHistory = [];
    this.temperatureHistory = [];
    this.humidityHistory = [];
    this.maxHistory = 100;
    
    // Статистика
    this.stats = {
      radiation: { min: Infinity, max: -Infinity, avg: 0 },
      temperature: { min: Infinity, max: -Infinity, avg: 0 },
      humidity: { min: Infinity, max: -Infinity, avg: 0 }
    };
    
    // Параметры работы
    this.isRunning = false;
    this.mode = 'simulation'; // simulation или esp32
    this.time = 0;
    this.timeScale = 1;
    
    // Параметры графика
    this.updateDimensions();
  }
Line-by-line explanation (6 lines)
this.radiation = 0; this.temperature = 0; this.humidity = 0;
Current readings - these smoothly interpolate toward target values each frame using lerp()
this.targetRadiation = 0; this.targetTemperature = 0; this.targetHumidity = 0;
Target values that come from either simulation math or ESP32 data - current values chase these smoothly
this.radiationHistory = []; this.temperatureHistory = []; this.humidityHistory = []; this.maxHistory = 100;
Three arrays that store the last 100 readings of each sensor, plus a maxHistory limit to prevent memory bloat
this.stats = { radiation: { min: Infinity, max: -Infinity, avg: 0 }, ... }
Statistics objects tracking minimum, maximum, and average for each sensor - these are displayed in the info panel
this.isRunning = false;
Flag controlling whether the simulation is active - set to true by the Start button
this.mode = 'simulation';
Determines whether data comes from mathematical simulation or live ESP32 hardware

update() - Data Generation & Smoothing

update() is the heartbeat of the sketch - it either generates simulated sensor data (using sine, noise, and mathematical correlations) or receives live ESP32 data. Then it uses lerp() to smoothly animate current values toward targets. Finally, it appends readings to history arrays every 5 frames and maintains statistics. This separation of simulation/live modes allows the same visualization code to work with both sources.

🔬 This code creates the radiation pattern - try changing 0.5 to 0.2 (slower cycle) or 1.0 (faster), and change 200 to 500 (more noise). What patterns emerge?

        let baseRadiation = map(sin(this.time * 0.5), -1, 1, 0, 1000);
        let radiationNoise = (noise(this.time * 0.1) - 0.5) * 200;
        this.targetRadiation = constrain(baseRadiation + radiationNoise, 0, 1200);
  update() {
    if (this.isRunning) {
      if (this.mode === 'simulation') {
        this.time += deltaTime * 0.001 * this.timeScale;
        
        // Имитация дневного цикла для солнечной радиации
        let baseRadiation = map(sin(this.time * 0.5), -1, 1, 0, 1000);
        let radiationNoise = (noise(this.time * 0.1) - 0.5) * 200;
        this.targetRadiation = constrain(baseRadiation + radiationNoise, 0, 1200);
        
        // Имитация температуры (коррелирует с радиацией)
        let baseTemp = map(this.targetRadiation, 0, 1200, 15, 35);
        let tempNoise = (noise(this.time * 0.15 + 100) - 0.5) * 5;
        this.targetTemperature = constrain(baseTemp + tempNoise, -10, 50);
        
        // Имитация влажности (обратно коррелирует с температурой)
        let baseHumidity = map(this.targetTemperature, 15, 35, 80, 30);
        let humidityNoise = (noise(this.time * 0.12 + 200) - 0.5) * 20;
        this.targetHumidity = constrain(baseHumidity + humidityNoise, 0, 100);
      }
      
      // Плавный переход к целевым значениям
      this.radiation = lerp(this.radiation, this.targetRadiation, 0.05);
      this.temperature = lerp(this.temperature, this.targetTemperature, 0.05);
      this.humidity = lerp(this.humidity, this.targetHumidity, 0.05);
      
      // Добавление в историю
      if (frameCount % 5 === 0) {
        this.radiationHistory.push(this.radiation);
        this.temperatureHistory.push(this.temperature);
        this.humidityHistory.push(this.humidity);
        
        if (this.radiationHistory.length > this.maxHistory) {
          this.radiationHistory.shift();
          this.temperatureHistory.shift();
          this.humidityHistory.shift();
        }
      }
      
      // Обновление статистики
      this.updateStats();
    }
  }
Line-by-line explanation (9 lines)

🔧 Subcomponents:

conditional Simulation Mode Data Generation if (this.mode === 'simulation') { ... }

Generates realistic sensor data using sine waves, Perlin noise, and mathematical correlations between metrics

calculation Solar Radiation Simulation let baseRadiation = map(sin(this.time * 0.5), -1, 1, 0, 1000);

Creates a sine-wave pattern simulating a daily solar cycle from 0 to 1000 W/m²

calculation Smooth Interpolation this.radiation = lerp(this.radiation, this.targetRadiation, 0.05);

Smoothly animates current value toward target over multiple frames (0.05 factor = 5% of distance per frame)

loop History Buffer Management if (frameCount % 5 === 0) { this.radiationHistory.push(this.radiation); ... }

Appends readings every 5 frames and removes oldest values when history exceeds maxHistory limit

this.time += deltaTime * 0.001 * this.timeScale;
Increments a time variable based on frame duration (deltaTime is milliseconds since last frame) - multiply by timeScale to speed up or slow down simulation
let baseRadiation = map(sin(this.time * 0.5), -1, 1, 0, 1000);
Uses sin() to create a smooth oscillating pattern mimicking a sunrise-to-sunset daily cycle - sin() ranges from -1 to 1, map() converts that to 0-1000
let radiationNoise = (noise(this.time * 0.1) - 0.5) * 200;
Perlin noise() generates natural-looking random fluctuations (0-0.5) converted to ±100 range, simulating cloud cover and sensor jitter
this.targetRadiation = constrain(baseRadiation + radiationNoise, 0, 1200);
Combines base pattern and noise, then clamps result between 0-1200 so it never exceeds realistic bounds
let baseTemp = map(this.targetRadiation, 0, 1200, 15, 35);
Creates correlation between radiation and temperature - higher radiation produces higher temperature (15°C min to 35°C max)
let baseHumidity = map(this.targetTemperature, 15, 35, 80, 30);
Inverse correlation - warmer days have lower humidity (80% at cold, 30% at hot), which is realistic for many climates
this.radiation = lerp(this.radiation, this.targetRadiation, 0.05);
lerp(current, target, 0.05) calculates: new = current + (target - current) * 0.05, moving 5% of the distance each frame
if (frameCount % 5 === 0) {
frameCount % 5 === 0 means this block runs every 5th frame (at 60fps = 12 times per second), preventing history from growing too quickly
if (this.radiationHistory.length > this.maxHistory) { this.radiationHistory.shift(); ... }
shift() removes the oldest array element (index 0) - this keeps the history window at a fixed size

updateStats()

updateStats() calculates min, max, and average for each sensor's history array. The reduce() pattern is a powerful JavaScript idiom: it folds an array down to a single value by applying a function to pairs of elements. Here it's used to sum all numbers, but reduce() can aggregate data in any way you imagine.

  updateStats() {
    if (this.radiationHistory.length > 0) {
      // Радиация
      this.stats.radiation.min = min(this.radiationHistory);
      this.stats.radiation.max = max(this.radiationHistory);
      this.stats.radiation.avg = this.radiationHistory.reduce((a, b) => a + b, 0) / this.radiationHistory.length;
      
      // Температура
      this.stats.temperature.min = min(this.temperatureHistory);
      this.stats.temperature.max = max(this.temperatureHistory);
      this.stats.temperature.avg = this.temperatureHistory.reduce((a, b) => a + b, 0) / this.temperatureHistory.length;
      
      // Влажность
      this.stats.humidity.min = min(this.humidityHistory);
      this.stats.humidity.max = max(this.humidityHistory);
      this.stats.humidity.avg = this.humidityHistory.reduce((a, b) => a + b, 0) / this.humidityHistory.length;
    }
  }
Line-by-line explanation (4 lines)

🔧 Subcomponents:

calculation Min/Max Calculation this.stats.radiation.min = min(this.radiationHistory);

Uses p5.js min() function to find the smallest value in the history array

calculation Average Calculation this.stats.radiation.avg = this.radiationHistory.reduce((a, b) => a + b, 0) / this.radiationHistory.length;

Uses reduce() to sum all values, then divides by count to get average

if (this.radiationHistory.length > 0) {
Only calculate stats if there is data - prevents errors when history is empty
this.stats.radiation.min = min(this.radiationHistory);
p5.js min() finds the smallest number in the array and stores it in stats.radiation.min
this.stats.radiation.max = max(this.radiationHistory);
p5.js max() finds the largest number in the array
this.stats.radiation.avg = this.radiationHistory.reduce((a, b) => a + b, 0) / this.radiationHistory.length;
reduce() loops through the array accumulating a sum (a + b), starting from 0, then divides by the array length to get average

drawGraph()

drawGraph() is the visual core of the sketch - it uses beginShape/endShape and vertex() to draw three overlaid line graphs. The key insight is that data values get mapped to pixel coordinates: array indices → x-positions (left to right), and data ranges → y-positions (bottom to top). The grid provides visual reference, and the legend explains colors. Each time draw() calls this, the graph updates smoothly as new data arrives.

🔬 This loop draws the radiation line by mapping each data value to a pixel position. What happens if you swap the two map() calls' min/max arguments - like mapping x from graphWidth to graphX instead? Try it for one metric and see it reverse direction!

      beginShape();
      for (let i = 0; i < this.radiationHistory.length; i++) {
        let x = map(i, 0, this.maxHistory - 1, this.graphX, this.graphX + this.graphWidth);
        let y = map(this.radiationHistory[i], 0, 1200, this.graphY + this.graphHeight, this.graphY);
        vertex(x, y);
      }
      endShape();
  drawGraph() {
    push();
    
    // Фон графика
    fill(255);
    stroke(224, 224, 224);
    strokeWeight(2);
    rect(this.graphX, this.graphY, this.graphWidth, this.graphHeight, 10);
    
    // Заголовок
    fill(25, 118, 210);
    noStroke();
    textSize(16);
    textAlign(LEFT, TOP);
    text('История измерений', this.graphX, this.graphY - 30);
    
    // Легенда
    let legendX = this.graphX + this.graphWidth - 200;
    let legendY = this.graphY + 10;
    
    // Радиация
    fill(255, 111, 0);
    rect(legendX, legendY, 20, 3);
    fill(44, 62, 80);
    textSize(12);
    textAlign(LEFT, CENTER);
    text('Радиация (Вт/м²)', legendX + 25, legendY);
    
    // Температура
    fill(25, 118, 210);
    rect(legendX, legendY + 20, 20, 3);
    fill(44, 62, 80);
    text('Температура (°C)', legendX + 25, legendY + 20);
    
    // Влажность
    fill(2, 136, 209);
    rect(legendX, legendY + 40, 20, 3);
    fill(44, 62, 80);
    text('Влажность (%)', legendX + 25, legendY + 40);
    
    // Сетка
    stroke(224, 224, 224);
    strokeWeight(1);
    
    for (let i = 0; i <= 4; i++) {
      let y = map(i, 0, 4, this.graphY + this.graphHeight, this.graphY);
      line(this.graphX, y, this.graphX + this.graphWidth, y);
    }
    
    for (let i = 0; i <= 10; i++) {
      let x = map(i, 0, 10, this.graphX, this.graphX + this.graphWidth);
      line(x, this.graphY, x, this.graphY + this.graphHeight);
    }
    
    // График радиации
    if (this.radiationHistory.length > 1) {
      noFill();
      stroke(255, 111, 0);
      strokeWeight(3);
      
      beginShape();
      for (let i = 0; i < this.radiationHistory.length; i++) {
        let x = map(i, 0, this.maxHistory - 1, this.graphX, this.graphX + this.graphWidth);
        let y = map(this.radiationHistory[i], 0, 1200, this.graphY + this.graphHeight, this.graphY);
        vertex(x, y);
      }
      endShape();
    }
    
    // График температуры
    if (this.temperatureHistory.length > 1) {
      noFill();
      stroke(25, 118, 210);
      strokeWeight(3);
      
      beginShape();
      for (let i = 0; i < this.temperatureHistory.length; i++) {
        let x = map(i, 0, this.maxHistory - 1, this.graphX, this.graphX + this.graphWidth);
        let y = map(this.temperatureHistory[i], -10, 50, this.graphY + this.graphHeight, this.graphY);
        vertex(x, y);
      }
      endShape();
    }
    
    // График влажности
    if (this.humidityHistory.length > 1) {
      noFill();
      stroke(2, 136, 209);
      strokeWeight(3);
      
      beginShape();
      for (let i = 0; i < this.humidityHistory.length; i++) {
        let x = map(i, 0, this.maxHistory - 1, this.graphX, this.graphX + this.graphWidth);
        let y = map(this.humidityHistory[i], 0, 100, this.graphY + this.graphHeight, this.graphY);
        vertex(x, y);
      }
      endShape();
    }
    
    pop();
  }
Line-by-line explanation (12 lines)

🔧 Subcomponents:

calculation Graph Background rect(this.graphX, this.graphY, this.graphWidth, this.graphHeight, 10);

Draws the white rectangular background for the graph area with rounded corners

calculation Legend with Color Codes fill(255, 111, 0); rect(legendX, legendY, 20, 3);

Draws colored rectangles next to text labels to identify each line's metric

for-loop Grid Lines for (let i = 0; i <= 4; i++) { let y = map(i, 0, 4, this.graphY + this.graphHeight, this.graphY); line(this.graphX, y, this.graphX + this.graphWidth, y); }

Draws 5 horizontal gridlines across the graph for reference

loop Radiation Line Drawing beginShape(); for (let i = 0; i < this.radiationHistory.length; i++) { ... vertex(x, y); } endShape();

Loops through all radiation history values, maps each to pixel coordinates, and connects them with a polyline

push();
Saves the current drawing settings (colors, stroke weight, etc.) so pop() can restore them later
rect(this.graphX, this.graphY, this.graphWidth, this.graphHeight, 10);
Draws the white background rectangle - graphX and graphY are the top-left corner, graphWidth and graphHeight are dimensions, 10 is corner radius
let legendX = this.graphX + this.graphWidth - 200;
Positions the legend 200 pixels from the right edge of the graph, so it fits in the upper-right corner
for (let i = 0; i <= 4; i++) { let y = map(i, 0, 4, this.graphY + this.graphHeight, this.graphY); line(...); }
Draws 5 horizontal gridlines evenly spaced from bottom to top - map() converts grid index (0-4) to pixel y-coordinates
for (let i = 0; i <= 10; i++) { let x = map(i, 0, 10, this.graphX, this.graphX + this.graphWidth); line(...); }
Draws 11 vertical gridlines evenly spaced from left to right
beginShape();
Starts recording vertices for a connected polyline shape
for (let i = 0; i < this.radiationHistory.length; i++) {
Loops through each data point in the radiation history array
let x = map(i, 0, this.maxHistory - 1, this.graphX, this.graphX + this.graphWidth);
Converts the data point index (0 to maxHistory-1) to a pixel x-coordinate across the graph width
let y = map(this.radiationHistory[i], 0, 1200, this.graphY + this.graphHeight, this.graphY);
Converts the radiation value (0-1200) to a pixel y-coordinate - note: y-axis is flipped (1200 maps to top, 0 maps to bottom)
vertex(x, y);
Adds a point to the shape at these coordinates - when endShape() is called, these vertices are connected by lines
endShape();
Finishes drawing the shape, connecting all vertices in order with lines
pop();
Restores all drawing settings that were saved by push()

GUI

The GUI class manages all the HTML controls and display elements. It creates buttons and dropdowns using p5.js DOM functions (createButton, createSelect, createDiv), places them in specific HTML divs using parent(), and attaches event handlers using mousePressed() and changed(). This bridges the canvas world and the DOM world - when users interact with buttons, the WeatherStation object updates.

class GUI {
  constructor() {
    this.esp32 = new ESP32Connection();
    this.createControls();
    this.createMainDisplay();
    this.createInfoPanel();
  }
  
  createControls() {
    let controlsDiv = select('#controls');
    
    // Кнопка старт/стоп
    this.startBtn = createButton('▶ Старт');
    this.startBtn.parent(controlsDiv);
    this.startBtn.mousePressed(() => {
      if (station.isRunning) {
        station.stop();
        this.startBtn.html('▶ Старт');
        this.startBtn.removeClass('active');
      } else {
        station.start();
        this.startBtn.html('⏸ Стоп');
        this.startBtn.addClass('active');
      }
    });
    
    // Кнопка сброса
    this.resetBtn = createButton('🔄 Сброс');
    this.resetBtn.parent(controlsDiv);
    this.resetBtn.mousePressed(() => {
      station.reset();
      station.stop();
      this.startBtn.html('▶ Старт');
      this.startBtn.removeClass('active');
    });
    
    // Выбор режима
    let modeGroup = createDiv('');
    modeGroup.parent(controlsDiv);
    modeGroup.class('control-group');
    
    let modeLabel = createElement('label', 'Режим:');
    modeLabel.parent(modeGroup);
    
    this.modeSelect = createSelect();
    this.modeSelect.parent(modeGroup);
    this.modeSelect.option('Симуляция', 'simulation');
    this.modeSelect.option('ESP32', 'esp32');
    this.modeSelect.changed(() => {
      station.mode = this.modeSelect.value();
      if (station.mode === 'esp32') {
        this.showConnectionDialog();
      }
    });
    
    // Скорость (только для симуляции)
    let speedGroup = createDiv('');
    speedGroup.parent(controlsDiv);
    speedGroup.class('control-group');
    
    let speedLabel = createElement('label', 'Скорость:');
    speedLabel.parent(speedGroup);
    
    this.speedSelect = createSelect();
    this.speedSelect.parent(speedGroup);
    this.speedSelect.option('0.5x', '0.5');
    this.speedSelect.option('1x', '1');
    this.speedSelect.option('2x', '2');
    this.speedSelect.option('5x', '5');
    this.speedSelect.selected('1');
    this.speedSelect.changed(() => {
      station.timeScale = parseFloat(this.speedSelect.value());
    });
  }
Line-by-line explanation (10 lines)

🔧 Subcomponents:

conditional Start/Stop Toggle if (station.isRunning) { station.stop(); ... } else { station.start(); ... }

Toggles simulation on/off and updates button text and styling

conditional Mode Selection Handler if (station.mode === 'esp32') { this.showConnectionDialog(); }

Prompts for ESP32 connection details when user switches to hardware mode

this.esp32 = new ESP32Connection();
Creates the WebSocket connection manager for potential ESP32 hardware
this.createControls(); this.createMainDisplay(); this.createInfoPanel();
Calls three helper methods to build the different sections of the UI
let controlsDiv = select('#controls');
Finds the HTML div with id 'controls' and stores a reference to it - all buttons will be placed inside
this.startBtn = createButton('▶ Старт');
Creates a button element with text '▶ Старт' (play icon + Russian 'Start')
this.startBtn.parent(controlsDiv);
Places the button inside the controlsDiv div in the HTML
this.startBtn.mousePressed(() => { ... });
Defines what happens when the user clicks the button - an arrow function is executed
if (station.isRunning) { station.stop(); ... } else { station.start(); ... }
Checks if simulation is running - if yes, stop it; if no, start it (toggle behavior)
this.startBtn.html('⏸ Стоп');
Changes the button's text to show '⏸ Стоп' (pause icon + Russian 'Stop')
this.startBtn.addClass('active');
Adds the CSS class 'active' to the button, which styles it green (from style.css)
this.modeSelect.option('Симуляция', 'simulation');
Adds a dropdown option with display text 'Симуляция' and value 'simulation'

createMainDisplay()

createMainDisplay() builds three sensor cards (radiation, temperature, humidity) by calling the helper createSensorCard() method. The cards are stored as instance variables so GUI.update() can refresh their values every frame.

  createMainDisplay() {
    let displayDiv = select('#main-display');
    
    // Карточка радиации
    this.radiationCard = this.createSensorCard(
      '☀️',
      'Солнечная радиация',
      '0.0',
      'Вт/м²',
      'radiation'
    );
    this.radiationCard.parent(displayDiv);
    
    // Карточка температуры
    this.temperatureCard = this.createSensorCard(
      '🌡️',
      'Температура',
      '0.0',
      '°C',
      'temperature'
    );
    this.temperatureCard.parent(displayDiv);
    
    // Карточка влажности
    this.humidityCard = this.createSensorCard(
      '💧',
      'Влажность',
      '0.0',
      '%',
      'humidity'
    );
    this.humidityCard.parent(displayDiv);
  }
Line-by-line explanation (3 lines)
let displayDiv = select('#main-display');
Finds the HTML div with id 'main-display' where the sensor cards will be placed
this.radiationCard = this.createSensorCard(...);
Calls createSensorCard() to build a styled card and stores the result in this.radiationCard so it can be updated later
this.radiationCard.parent(displayDiv);
Places the newly created card div inside the displayDiv

createSensorCard()

createSensorCard() is a helper that builds reusable sensor display cards. It creates a hierarchy of nested divs (card > icon, label, value, unit) and stores a reference to the valueEl so it can be updated efficiently without rebuilding the entire card each frame.

  createSensorCard(icon, label, value, unit, type) {
    let card = createDiv('');
    card.class('sensor-card');
    card.class(type);
    
    let iconEl = createDiv(icon);
    iconEl.class('icon');
    iconEl.parent(card);
    
    let labelEl = createDiv(label);
    labelEl.class('label');
    labelEl.parent(card);
    
    let valueEl = createDiv(value);
    valueEl.class('value');
    valueEl.parent(card);
    card.valueEl = valueEl;
    
    let unitEl = createDiv(unit);
    unitEl.class('unit');
    unitEl.parent(card);
    
    return card;
  }
Line-by-line explanation (4 lines)
let card = createDiv('');
Creates an empty div that will hold the card's content
card.class('sensor-card'); card.class(type);
Adds two CSS classes: 'sensor-card' for common styling, and a type-specific class like 'radiation' or 'temperature' for individual colors
let iconEl = createDiv(icon); iconEl.class('icon'); iconEl.parent(card);
Creates a child div inside the card containing the emoji icon (☀️, 🌡️, or 💧) and styles it with CSS class 'icon'
card.valueEl = valueEl;
Stores a reference to the value element so GUI.update() can easily change its text later by calling this.radiationCard.valueEl.html(newValue)

createInfoPanel()

createInfoPanel() builds a statistics grid showing min/max/average for all three metrics. Nine stat items are created and stored as instance variables - this allows GUI.update() to efficiently refresh the values without rebuilding the entire panel.

  createInfoPanel() {
    let infoDiv = select('#info-panel');
    
    let title = createElement('div', 'Статистика измерений');
    title.class('info-title');
    title.parent(infoDiv);
    
    let statsGrid = createDiv('');
    statsGrid.class('stats-grid');
    statsGrid.parent(infoDiv);
    
    // Статистика радиации
    this.radMinStat = this.createStatItem('Мин. радиация', '0.0', 'Вт/м²', 'radiation-stat');
    this.radMinStat.parent(statsGrid);
    
    this.radMaxStat = this.createStatItem('Макс. радиация', '0.0', 'Вт/м²', 'radiation-stat');
    this.radMaxStat.parent(statsGrid);
    
    this.radAvgStat = this.createStatItem('Средн. радиация', '0.0', 'Вт/м²', 'radiation-stat');
    this.radAvgStat.parent(statsGrid);
    
    // Статистика температуры
    this.tempMinStat = this.createStatItem('Мин. температура', '0.0', '°C', 'temperature-stat');
    this.tempMinStat.parent(statsGrid);
    
    this.tempMaxStat = this.createStatItem('Макс. температура', '0.0', '°C', 'temperature-stat');
    this.tempMaxStat.parent(statsGrid);
    
    this.tempAvgStat = this.createStatItem('Средн. температура', '0.0', '°C', 'temperature-stat');
    this.tempAvgStat.parent(statsGrid);
    
    // Статистика влажности
    this.humMinStat = this.createStatItem('Мин. влажность', '0.0', '%', 'humidity-stat');
    this.humMinStat.parent(statsGrid);
    
    this.humMaxStat = this.createStatItem('Макс. влажность', '0.0', '%', 'humidity-stat');
    this.humMaxStat.parent(statsGrid);
    
    this.humAvgStat = this.createStatItem('Средн. влажность', '0.0', '%', 'humidity-stat');
    this.humAvgStat.parent(statsGrid);
  }
Line-by-line explanation (3 lines)
let infoDiv = select('#info-panel');
Finds the HTML div with id 'info-panel' where statistics will be displayed
let statsGrid = createDiv(''); statsGrid.class('stats-grid');
Creates a container div for all statistics items and applies CSS class 'stats-grid' for grid layout (likely CSS Grid or Flexbox)
this.radMinStat = this.createStatItem('Мин. радиация', '0.0', 'Вт/м²', 'radiation-stat');
Creates a statistics display item for minimum radiation and stores a reference so GUI.update() can refresh its value

createStatItem()

createStatItem() is a helper similar to createSensorCard() - it builds a reusable statistics display with title, value, and unit, and stores a reference to the value element for efficient updates.

  createStatItem(title, value, unit, type) {
    let item = createDiv('');
    item.class('stat-item');
    item.class(type);
    
    let titleEl = createElement('h3', title);
    titleEl.parent(item);
    
    let valueEl = createDiv(value);
    valueEl.class('stat-value');
    valueEl.parent(item);
    item.valueEl = valueEl;
    
    let unitEl = createDiv(unit);
    unitEl.class('stat-unit');
    unitEl.parent(item);
    
    return item;
  }
Line-by-line explanation (1 lines)
item.valueEl = valueEl;
Stores a reference to the value element so createInfoPanel() can easily update it via GUI.update()

update() - GUI Display Refresh

GUI.update() runs every frame (called from draw()) and refreshes all nine statistics displays. Since it only updates the innerHTML of existing elements, it's very efficient compared to rebuilding the DOM. toFixed(1) ensures all numbers show exactly one decimal place for consistent formatting.

  update() {
    // Обновление главных карточек с увеличенными значениями
    this.radiationCard.valueEl.html(station.radiation.toFixed(1));
    this.temperatureCard.valueEl.html(station.temperature.toFixed(1));
    this.humidityCard.valueEl.html(station.humidity.toFixed(1));
    
    // Обновление статистики
    if (station.radiationHistory.length > 0) {
      this.radMinStat.valueEl.html(station.stats.radiation.min.toFixed(1));
      this.radMaxStat.valueEl.html(station.stats.radiation.max.toFixed(1));
      this.radAvgStat.valueEl.html(station.stats.radiation.avg.toFixed(1));
      
      this.tempMinStat.valueEl.html(station.stats.temperature.min.toFixed(1));
      this.tempMaxStat.valueEl.html(station.stats.temperature.max.toFixed(1));
      this.tempAvgStat.valueEl.html(station.stats.temperature.avg.toFixed(1));
      
      this.humMinStat.valueEl.html(station.stats.humidity.min.toFixed(1));
      this.humMaxStat.valueEl.html(station.stats.humidity.max.toFixed(1));
      this.humAvgStat.valueEl.html(station.stats.humidity.avg.toFixed(1));
    }
  }
Line-by-line explanation (3 lines)
this.radiationCard.valueEl.html(station.radiation.toFixed(1));
Reads the current radiation value from the station, rounds it to 1 decimal place using toFixed(1), and updates the card's value display
if (station.radiationHistory.length > 0) {
Only updates statistics if there is data - prevents showing 'Infinity' or 'NaN' when history is empty
this.radMinStat.valueEl.html(station.stats.radiation.min.toFixed(1));
Updates the minimum radiation display by reading from station.stats and formatting with toFixed()

📦 Key Variables

station object (WeatherStation)

Global instance of WeatherStation that stores all sensor readings, history, and statistics

let station;
gui object (GUI)

Global instance of GUI that manages all interactive controls and display elements

let gui;
radiation number

Current solar radiation reading in W/m² that smoothly interpolates toward targetRadiation

this.radiation = 0;
temperature number

Current temperature reading in °C that smoothly interpolates toward targetTemperature

this.temperature = 0;
humidity number

Current humidity reading as percentage that smoothly interpolates toward targetHumidity

this.humidity = 0;
radiationHistory array of numbers

Array storing up to 100 radiation readings, used to plot the graph and calculate statistics

this.radiationHistory = [];
temperatureHistory array of numbers

Array storing up to 100 temperature readings for graphing and statistics

this.temperatureHistory = [];
humidityHistory array of numbers

Array storing up to 100 humidity readings for graphing and statistics

this.humidityHistory = [];
stats object

Object containing min/max/average statistics for each metric, updated from history arrays

this.stats = { radiation: { min: Infinity, max: -Infinity, avg: 0 }, ... };
isRunning boolean

Flag controlling whether the simulation is active - true when user clicks Start, false when they click Stop

this.isRunning = false;
mode string

Determines data source: 'simulation' for math-generated data or 'esp32' for live hardware

this.mode = 'simulation';
time number

Accumulated simulation time in seconds, used to drive sine waves and Perlin noise patterns

this.time = 0;
timeScale number

Multiplier for simulation speed: 0.5 = half speed, 2 = double speed, 5 = five times faster

this.timeScale = 1;
graphX, graphY, graphWidth, graphHeight number

Coordinates and dimensions of the graph rectangle on the canvas in pixels

this.graphX = 50; this.graphY = 50;
maxHistory number

Maximum number of data points to keep in history arrays (100) - older points are removed when this limit is exceeded

this.maxHistory = 100;

🔧 Potential Improvements (6)

Here are some ways this code could be enhanced:

BUG ESP32Connection.connect()

WebSocket auto-reconnect will attempt to reconnect even if the URL was invalid or the user manually disconnected - leads to infinite retry loops

💡 Add a user-initiated disconnect flag that distinguishes between network failure and intentional disconnection. Only auto-reconnect on network errors, not manual disconnects.

PERFORMANCE drawGraph()

The grid lines loop and line drawing loops recalculate coordinates every frame even though graph dimensions are constant

💡 Pre-calculate grid line coordinates in updateDimensions() and store them as arrays, then reuse in drawGraph() to skip the map() calls each frame

STYLE WeatherStation class

Magic numbers like 1000, 1200, 15, 35, 80, 30, 100 are scattered throughout simulation code - hard to understand and modify

💡 Define named constants at the top of the class: const RADIATION_MAX = 1200, TEMP_MIN = 15, TEMP_MAX = 35, HUMIDITY_MAX = 100, etc. Makes the code self-documenting

FEATURE GUI.createControls()

Speed control only affects simulation mode - ESP32 mode ignores it completely, confusing users who switch modes

💡 Disable or hide the speed selector when mode is 'esp32', and visually disable it or show a 'N/A' state. Re-enable it when switching back to simulation.

BUG updateStats()

If history array has only 1 element, min() and max() return that element (correct), but the visualization might look strange with a point instead of a line

💡 In drawGraph(), check if history.length > 1 before drawing (already done), and consider showing a placeholder message if no data exists yet

PERFORMANCE GUI.update()

Updates all nine stat items every single frame even if data hasn't changed (values update only every 5 frames in WeatherStation.update())

💡 Cache previous values and only call .html() when a value actually changes, reducing DOM manipulations by ~80%

🔄 Code Flow

Code flow showing setup, draw, windowresized, esp32connection, weatherstation, update, updatestats, drawgraph, gui, createmainDisplay, createsensorcard, createinfopanel, createstatitem, guiupdate

💡 Click on function names in the diagram to jump to their code

graph TD start[Start] --> setup[setup] setup --> draw[draw loop] draw --> update[update] draw --> display[display] draw --> guiupdate[gui.update] update --> simulation-block[simulation-block] update --> history-buffer[history-buffer] update --> updatestats[updatestats] simulation-block --> radiation-sim[radiation-sim] simulation-block --> lerp-smoothing[lerp-smoothing] history-buffer --> min-max-calc[min-max-calc] history-buffer --> average-calc[average-calc] display --> drawgraph[drawgraph] drawgraph --> background-rect[background-rect] drawgraph --> grid-lines[grid-lines] drawgraph --> radiation-line[radiation-line] drawgraph --> legend[legend] guiupdate --> createmainDisplay[createmainDisplay] guiupdate --> createinfopanel[createInfoPanel] createmainDisplay --> createsensorcard[createsensorcard] createinfopanel --> createstatitem[createstatitem] windowresized[windowresized] --> draw esp32connection[esp32connection] --> connect-method[connect-method] connect-method --> onmessage-handler[onmessage-handler] connect-method --> reconnect-timeout[reconnect-timeout] click setup href "#fn-setup" click draw href "#fn-draw" click update href "#fn-update" click guiupdate href "#fn-guiupdate" click updatestats href "#fn-updatestats" click drawgraph href "#fn-drawgraph" click createmainDisplay href "#fn-createmainDisplay" click createinfopanel href "#fn-createInfoPanel" click createsensorcard href "#fn-createsensorcard" click createstatitem href "#fn-createstatitem" click windowresized href "#fn-windowresized" click esp32connection href "#fn-esp32connection" click connect-method href "#sub-connect-method" click onmessage-handler href "#sub-onmessage-handler" click reconnect-timeout href "#sub-reconnect-timeout" click simulation-block href "#sub-simulation-block" click radiation-sim href "#sub-radiation-sim" click lerp-smoothing href "#sub-lerp-smoothing" click history-buffer href "#sub-history-buffer" click min-max-calc href "#sub-min-max-calc" click average-calc href "#sub-average-calc" click background-rect href "#sub-background-rect" click legend href "#sub-legend" click grid-lines href "#sub-grid-lines" click radiation-line href "#sub-radiation-line" click start-button href "#sub-start-button" click mode-select href "#sub-mode-select"

❓ Frequently Asked Questions

What visual elements does the aktinometr (Remix) sketch display?

The sketch visually represents environmental data such as solar radiation, temperature, and humidity, providing a dynamic interface that updates with real-time information.

How can users interact with the aktinometr (Remix) sketch?

Users can interact with the sketch through a graphical user interface (GUI) that displays readings and may allow for adjustments or settings related to the environmental monitoring.

What creative coding concept does the aktinometr (Remix) sketch showcase?

This sketch demonstrates the use of real-time data visualization by connecting to an ESP32 microcontroller, showcasing how to integrate hardware with creative coding.

Preview

aktinometr (Remix) - p5.js creative coding sketch preview
Sketch Preview
Code flow diagram showing the structure of aktinometr (Remix) - Code flow showing setup, draw, windowresized, esp32connection, weatherstation, update, updatestats, drawgraph, gui, createmainDisplay, createsensorcard, createinfopanel, createstatitem, guiupdate
Code Flow Diagram