
Audio Reactive

This sketch creates a real-time audio visualization that responds to sound from your microphone. Colorful spectrum bars dance across the canvas with the audio frequencies, while a central circle pulses with the overall volume level, creating an immersive visual representation of sound.

🧪 Try This!

Experiment with the code by making these changes:

  1. Make bars thinner and more numerous — Skipping fewer frequencies reveals more detailed spectrum information and creates a denser, more intricate visual pattern
  2. Slow down the circle color rotation — Dividing frameCount by a larger number makes the hue cycle more slowly, creating a more relaxed shimmering effect
  3. Create persistent motion trails — Reducing the background alpha to 5 makes previous bar positions fade very slowly, painting a ghostly trail of the sound's history
  4. Invert the color spectrum — Flipping the hue mapping so high frequencies are red and low frequencies are purple creates a mirror-image rainbow effect
  5. Make the circle much larger at high volume — Increasing the maximum circle size (400) to 800 lets the circle expand dramatically when you make loud sounds
Prefer the full editor? Open it there →

📖 About This Sketch

This sketch transforms sound into color and motion by analyzing your microphone input in real time. It uses two key p5.sound techniques: FFT (Fast Fourier Transform) to break audio into individual frequency bands, and getLevel() to measure overall volume. The result is a hypnotic display where vertical spectrum bars climb and fall with different frequencies, each colored along the rainbow, while a central circle grows and shrinks to match how loud you are. This is one of the most rewarding first audio projects because the visual feedback is immediate and satisfying.

The code is organized around two main calculations in the draw loop: analyzing the audio spectrum and measuring microphone volume. By studying it, you'll learn how p5.sound provides real-time audio data, how to map audio values into visual properties like height and hue, and how to create responsive interactions that feel alive. You'll see HSB color mode in action, array iteration over frequency data, and the draw loop working at 60 frames per second to keep visuals in sync with sound.

⚙️ How It Works

  1. When the sketch loads, setup() creates a full-window canvas and requests microphone access via userStartAudio(). It initializes a p5.AudioIn object to capture sound and an FFT analyzer to break that sound into frequency bands.
  2. Every frame, draw() first fades the background slightly with a semi-transparent rectangle, keeping trails of previous bars visible and creating a sense of motion.
  3. The spectrum array—256 frequency values from low to high—is analyzed and drawn as bars: each bar's height represents how loud that frequency is, and its color shifts along the rainbow based on its position in the spectrum.
  4. The microphone's overall volume level is measured and mapped to a circle size, so the circle pulses bigger when it's loud and smaller when it's quiet.
  5. The circle's hue rotates every frame using frameCount, making it shimmer through colors continuously.
  6. The canvas resizes automatically when the window is resized, keeping the visualization full-screen.

🎓 Concepts You'll Learn

Audio input and microphone accessFFT spectrum analysisReal-time data visualizationHSB color modeMapping and scaling valuesArray iterationResponsive canvas resizing

📝 Code Breakdown

setup()

setup() runs once when the sketch starts. Here we prepare the canvas size, request microphone access, and initialize both the audio input and the FFT analyzer that will power the visualization. The FFT is what breaks audio into frequency bands—without it, we'd only have total volume, not the colorful spectrum bars.

function setup() {
  createCanvas(windowWidth, windowHeight);
  
  // Click to start audio
  userStartAudio();
  
  mic = new p5.AudioIn();
  mic.start();
  
  fft = new p5.FFT();
  fft.setInput(mic);
  
  colorMode(HSB, 360, 100, 100, 100);
}
Line-by-line explanation (7 lines)

🔧 Subcomponents:

calculation Microphone Setup mic = new p5.AudioIn();

Creates a new audio input object that will capture sound from the user's microphone

calculation FFT Analyzer Setup fft = new p5.FFT(); fft.setInput(mic);

Creates an FFT analyzer that breaks the microphone sound into individual frequency bands for visualization

createCanvas(windowWidth, windowHeight);
Creates a canvas that fills the entire browser window, so the visualization spans the full screen
userStartAudio();
Requests permission to access the microphone—required by browsers for security before any audio can be captured
mic = new p5.AudioIn();
Creates a new p5.AudioIn object that will listen to and record sound from your microphone
mic.start();
Starts the microphone capturing audio in the background—from this point on, mic data is available to analyze
fft = new p5.FFT();
Creates a Fast Fourier Transform analyzer, which converts audio into frequency data (how loud each pitch range is)
fft.setInput(mic);
Tells the FFT analyzer to listen to the microphone input so it can break that audio into frequency bands
colorMode(HSB, 360, 100, 100, 100);
Switches to HSB (Hue, Saturation, Brightness) color mode so colors can be mapped directly from frequencies—hue 0-360 matches the rainbow

draw()

draw() runs 60 times per second and is where all the real work happens. It analyzes fresh audio data every frame, maps that data to visual properties (position, size, color), and draws everything. The key insight: FFT gives you an array of 256 frequencies, and map() is how you convert those raw numbers into canvas coordinates and colors. The semi-transparent background creates trails that fade over time, and the circle size tied to volume makes the visualization feel responsive to sound.

🔬 These three lines control which frequencies are drawn and how tall they are. What happens if you change i += 4 to i += 1? To i += 8? How does it change the visual density?

  for (let i = 0; i < spectrum.length; i += 4) {
    let x = map(i, 0, spectrum.length, 0, width);
    let h = map(spectrum[i], 0, 255, 0, height * 0.8);

🔬 These lines make the circle pulse and rotate. What happens if you change 70, 90 (saturation and brightness) to lower numbers like 30, 50? Try it and listen to how the visual mood changes when the circle becomes more muted.

  let size = map(vol, 0, 0.5, 50, 400);
  fill(frameCount % 360, 70, 90, 50);
  ellipse(width / 2, height / 2, size);
function draw() {
  background(0, 0, 10, 20);
  
  let spectrum = fft.analyze();
  let vol = mic.getLevel();
  
  // Draw spectrum bars
  noStroke();
  for (let i = 0; i < spectrum.length; i += 4) {
    let x = map(i, 0, spectrum.length, 0, width);
    let h = map(spectrum[i], 0, 255, 0, height * 0.8);
    let hue = map(i, 0, spectrum.length, 0, 360);
    
    fill(hue, 80, 90, 80);
    rect(x, height - h, width / spectrum.length * 4 - 2, h);
  }
  
  // Center circle based on volume
  let size = map(vol, 0, 0.5, 50, 400);
  fill(frameCount % 360, 70, 90, 50);
  ellipse(width / 2, height / 2, size);
  
  // Instructions
  fill(0, 0, 100);
  textSize(14);
  textAlign(CENTER, TOP);
  text('Click to enable audio • Make some noise!', width / 2, 20);
}
Line-by-line explanation (14 lines)

🔧 Subcomponents:

for-loop Spectrum Bar Loop for (let i = 0; i < spectrum.length; i += 4) {

Iterates through the frequency array, stepping by 4 to reduce the number of bars and improve performance

calculation Bar Position Mapping let x = map(i, 0, spectrum.length, 0, width);

Converts frequency array index into a horizontal canvas position so bars spread across the screen

calculation Bar Height Mapping let h = map(spectrum[i], 0, 255, 0, height * 0.8);

Maps frequency amplitude (0-255) to bar height, capped at 80% of canvas height

calculation Hue Color Mapping let hue = map(i, 0, spectrum.length, 0, 360);

Maps each frequency's position to a hue value, creating the rainbow spectrum of bar colors

calculation Circle Pulse let size = map(vol, 0, 0.5, 50, 400);

Maps microphone volume level to circle diameter, making it pulse with sound

calculation Circle Color Rotation fill(frameCount % 360, 70, 90, 50);

Makes the circle's hue rotate every frame using frameCount, creating a shimmering rainbow effect

background(0, 0, 10, 20);
Clears the canvas with a semi-transparent dark layer (alpha 20)—low alpha leaves trails, creating motion blur
let spectrum = fft.analyze();
Analyzes the current audio from the microphone and returns an array of 256 values representing the amplitude at each frequency band
let vol = mic.getLevel();
Gets the overall volume level (0 to 1) from the microphone, representing how loud the sound is right now
noStroke();
Turns off the outline for shapes, so bars are solid colored rectangles with no borders
for (let i = 0; i < spectrum.length; i += 4) {
Loops through the spectrum array, jumping by 4 each time (so i = 0, 4, 8, 12...)—this reduces bar count and runs faster
let x = map(i, 0, spectrum.length, 0, width);
Converts the frequency index i (0 to 256) into an x-position (0 to canvas width) so bars are evenly spread horizontally
let h = map(spectrum[i], 0, 255, 0, height * 0.8);
Maps the amplitude of frequency i (0-255) to a height in pixels (0 to 80% of canvas height) so louder frequencies have taller bars
let hue = map(i, 0, spectrum.length, 0, 360);
Maps the frequency position i to a hue value (0-360 degrees), creating a rainbow where low frequencies are red and high are purple
fill(hue, 80, 90, 80);
Sets the bar color using HSB: hue (varies by frequency), saturation 80, brightness 90, alpha 80 (slightly transparent)
rect(x, height - h, width / spectrum.length * 4 - 2, h);
Draws a rectangle from the bottom of the canvas upward (height - h), with width matching the bar spacing and height h from the frequency
let size = map(vol, 0, 0.5, 50, 400);
Maps microphone volume (0 to 0.5) to circle diameter (50 to 400 pixels), so louder sound makes a bigger circle
fill(frameCount % 360, 70, 90, 50);
Sets circle color: hue cycles 0-359 every 360 frames (creating a slow rainbow rotation), semi-transparent (alpha 50)
ellipse(width / 2, height / 2, size);
Draws the circle at the canvas center, with diameter equal to size (which grows and shrinks with volume)
text('Click to enable audio • Make some noise!', width / 2, 20);
Displays instructions at the top of the canvas so the user knows they need to click to enable the microphone

windowResized()

windowResized() is a special p5.js function that runs automatically whenever the browser window is resized. Without it, the canvas would stay a fixed size and wouldn't fill the window properly if the user dragged the edge. This function keeps the visualization full-screen and responsive.

function windowResized() {
  resizeCanvas(windowWidth, windowHeight);
}
Line-by-line explanation (1 lines)
resizeCanvas(windowWidth, windowHeight);
Resizes the p5.js canvas to match the browser window's new dimensions whenever the user resizes their window

📦 Key Variables

mic object

A p5.AudioIn object that captures sound from the user's microphone in real time

let mic;
mic = new p5.AudioIn();
mic.start();
fft object

A p5.FFT (Fast Fourier Transform) analyzer that breaks audio into 256 frequency bands, each representing the amplitude at a different pitch range

let fft;
fft = new p5.FFT();
fft.setInput(mic);
spectrum array

An array of 256 numbers (0-255) representing the amplitude at each frequency band, analyzed fresh every frame from the microphone input

let spectrum = fft.analyze();
vol number

The overall microphone volume level as a decimal from 0 to 1, used to control the size of the central circle

let vol = mic.getLevel();
x number

The horizontal canvas position of a spectrum bar, calculated by mapping its frequency index to the canvas width

let x = map(i, 0, spectrum.length, 0, width);
h number

The height of a spectrum bar in pixels, calculated by mapping its frequency amplitude to a height on the canvas

let h = map(spectrum[i], 0, 255, 0, height * 0.8);
hue number

The color (0-360 degrees on the HSB hue wheel) for a spectrum bar, mapped from its frequency position so bars create a rainbow

let hue = map(i, 0, spectrum.length, 0, 360);
size number

The diameter of the central circle in pixels, mapped from microphone volume so it grows when sound is loud

let size = map(vol, 0, 0.5, 50, 400);

🔧 Potential Improvements (5)

Here are some ways this code could be enhanced:

BUG draw() - spectrum bar drawing

Bars can be drawn partially off-screen at the right edge because rect() uses x position without accounting for bar width when x approaches width

💡 Clamp the bar width or add a bounds check: let barWidth = min(width / spectrum.length * 4 - 2, width - x);

PERFORMANCE draw() - background with alpha

Using semi-transparent background(0, 0, 10, 20) every frame is slower than solid background() because it requires blending each pixel

💡 For better performance on lower-end devices, consider using background(0) every frame and drawing semi-transparent rectangles instead if you want trails: fill(0, 0, 10, 20); rect(0, 0, width, height);

STYLE draw() - text rendering

The instruction text is redrawn every frame even though it doesn't change, and textAlign/textSize are set every frame unnecessarily

💡 Move textSize(14) and textAlign(CENTER, TOP) to setup() so they're only set once, improving clarity that text only needs rendering once

FEATURE draw() - circle

The circle has fixed saturation and brightness in HSB (70, 90), so it looks the same brightness regardless of volume—visual feedback could be stronger

💡 Map volume to brightness too: fill(frameCount % 360, 70, map(vol, 0, 0.5, 30, 90), 50); so the circle brightens when you make noise

BUG setup() - userStartAudio()

userStartAudio() works but modern browsers increasingly require a user gesture (click/touch) before audio can truly start; this might fail silently on some devices

💡 Add user-friendly feedback and consider wrapping audio start in a clickable prompt or checking mic.enabled after start()

🔄 Code Flow

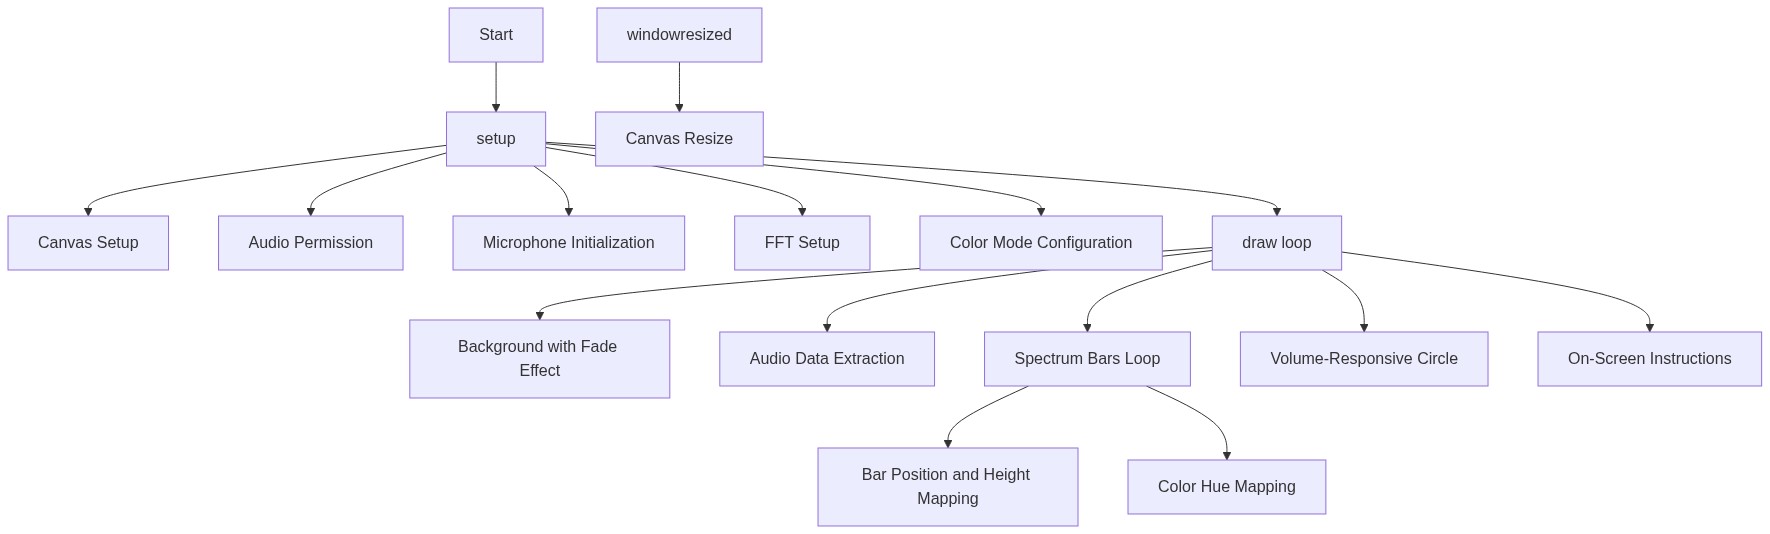
Code flow showing setup, draw, windowresized

💡 Click on function names in the diagram to jump to their code

graph TD start[Start] --> setup[setup] setup --> microphone_init[Microphone Setup] setup --> fft_init[FFT Analyzer Setup] setup --> draw[draw loop] click setup href "#fn-setup" click microphone_init href "#sub-microphone-init" click fft_init href "#sub-fft-init" draw --> spectrum_loop[Spectrum Bar Loop] spectrum_loop --> bar_position_calc[Bar Position Mapping] spectrum_loop --> bar_height_calc[Bar Height Mapping] spectrum_loop --> hue_calc[Hue Color Mapping] click draw href "#fn-draw" click spectrum_loop href "#sub-spectrum-loop" click bar_position_calc href "#sub-bar-position-calc" click bar_height_calc href "#sub-bar-height-calc" click hue_calc href "#sub-hue-calc" draw --> circle_size_calc[Circle Pulse] draw --> circle_hue_calc[Circle Color Rotation] click circle_size_calc href "#sub-circle-size-calc" click circle_hue_calc href "#sub-circle-hue-calc" draw --> draw spectrum_loop --> draw circle_size_calc --> draw circle_hue_calc --> draw setup --> windowresized[windowResized] click windowresized href "#fn-windowresized"

❓ Frequently Asked Questions

What visual effects can I expect from the Audio Reactive sketch?

The sketch generates vibrant spectrum bars that respond to audio input, along with a dynamically-sized center circle that reacts to volume levels.

How do I interact with the Audio Reactive sketch?

Users can interact by clicking to enable audio input and then making noise to see the visual effects change in real-time.

What creative coding concepts are showcased in this Audio Reactive sketch?

This sketch demonstrates audio analysis and visualization techniques using the p5.js library, specifically through frequency spectrum analysis and real-time visual feedback.

Preview

Audio Reactive - p5.js creative coding sketch preview
Sketch Preview
Code flow diagram showing the structure of Audio Reactive - Code flow showing setup, draw, windowresized
Code Flow Diagram