
Audio Reactive sensor

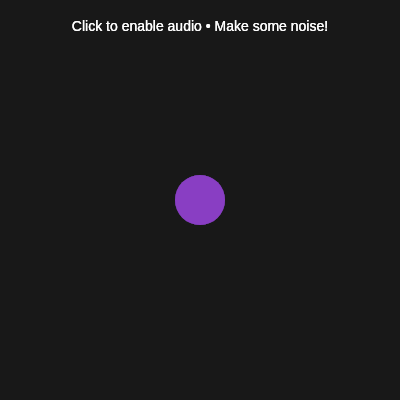
This sketch creates a real-time audio visualization that responds to microphone input. Colorful frequency bars dance across the canvas based on audio frequencies, while a pulsing circle at the center grows and shrinks with the overall volume level.

🧪 Try This!

Experiment with the code by making these changes:

  1. Make bars thicker — Removing the step in the loop (i += 4 → i += 1) draws every frequency instead of every 4th, filling the canvas with dense bars
  2. Invert the colors — Changing the hue map from 0–360 to 360–0 reverses the rainbow gradient, so reds appear on the right instead of the left
  3. Make the circle solid — Increasing the circle alpha from 50 to 100 makes it fully opaque and stops previous frames from showing through
  4. Slow the color rotation — Dividing frameCount by 2 makes the circle's hue change twice as slowly, creating a more relaxed color shift
  5. Hide the instructions — Removing the text() call makes the instruction at the top disappear, giving the visualization more space
Prefer the full editor? Open it there →

📖 About This Sketch

This sketch transforms sound into a visual experience by capturing microphone input and analyzing its frequency content. The canvas fills with a rainbow spectrum of bars that height-map to different audio frequencies, creating a classic equalizer effect. At the center, a semi-transparent circle pulses larger or smaller depending on how loud the sound is. The visualization uses p5.sound's FFT (Fast Fourier Transform) library to break down audio into frequency buckets, HSB color mode to cycle through hues, and the canvas window-resizing feature to adapt to any screen size.

The code is organized around three core p5.js concepts: the p5.sound library for audio input and analysis, the FFT algorithm for frequency decomposition, and the draw loop for real-time updating. By studying it, you will learn how to request microphone permissions, analyze audio frequencies, map data to visual properties (height, color, size), and create a sketch that responds meaningfully to external input.

⚙️ How It Works

  1. When the sketch loads, setup() initializes the canvas to fill the window, creates a microphone input object, and creates an FFT analyzer that watches the microphone stream
  2. The userStartAudio() function pauses until the user clicks, at which point the browser requests microphone permissions and audio analysis begins
  3. Every frame, draw() calls fft.analyze() to get an array of 1024 frequency values (0–255) representing different frequencies in the audio spectrum
  4. The sketch maps each frequency value to a bar height and draws colored bars across the canvas, with hue (color) cycling from left to right across the frequency range
  5. Meanwhile, mic.getLevel() returns the overall volume (0–1), which is mapped to a circle diameter that pulses at the center of the canvas
  6. The HSB color mode allows hue to cycle through 0–360 degrees naturally, creating a rainbow effect that updates every frame

🎓 Concepts You'll Learn

p5.sound FFT frequency analysisMicrophone input and audio levelHSB color mode and hue cyclingMapping data to visual propertiesReal-time animation loopWindow resize handling

📝 Code Breakdown

setup()

setup() runs once when the sketch starts. Here we initialize the canvas size, request microphone permission, and configure the audio analysis tools. The p5.sound library requires userStartAudio() to be called before mic input works—this is a browser security feature.

function setup() {
  createCanvas(windowWidth, windowHeight);
  
  // Click to start audio
  userStartAudio();
  
  mic = new p5.AudioIn();
  mic.start();
  
  fft = new p5.FFT();
  fft.setInput(mic);
  
  colorMode(HSB, 360, 100, 100, 100);
}
Line-by-line explanation (7 lines)

🔧 Subcomponents:

initialization Microphone and FFT Setup mic = new p5.AudioIn(); mic.start(); fft = new p5.FFT(); fft.setInput(mic);

Creates a microphone input object and an FFT analyzer that listens to the microphone stream

initialization HSB Color Mode colorMode(HSB, 360, 100, 100, 100);

Sets color mode to Hue-Saturation-Brightness where hue ranges 0–360 (like a color wheel), making rainbow effects easy

createCanvas(windowWidth, windowHeight);
Creates a canvas that fills the entire browser window, using special variables that update if the window resizes
userStartAudio();
Pauses the sketch and waits for the user to click before starting audio input—this is required by web browsers for security
mic = new p5.AudioIn();
Creates a new microphone input object that will capture sound from the user's device
mic.start();
Starts listening to the microphone and collecting audio data
fft = new p5.FFT();
Creates a new FFT (Fast Fourier Transform) object that will break audio into separate frequency bands
fft.setInput(mic);
Tells the FFT analyzer to listen to the microphone input instead of other audio sources
colorMode(HSB, 360, 100, 100, 100);
Switches from RGB to HSB color mode: hue (0–360 like a rainbow wheel), saturation (0–100), brightness (0–100), alpha (0–100)
draw()

draw() is called 60 times per second, analyzing fresh audio every frame. The fft.analyze() array has 1024 elements by default, each representing a frequency band from ~20 Hz to ~20,000 Hz. By mapping these values to bar heights and distributing them across the canvas, we create a real-time equalizer effect. The semi-transparent background (alpha 20%) accumulates previous frames, creating motion trails that make the visualization feel alive.

🔬 This loop draws one bar per frequency band. What happens if you change i += 4 to i += 2 or i += 8? How does bar density change?

  for (let i = 0; i < spectrum.length; i += 4) {
    let x = map(i, 0, spectrum.length, 0, width);
    let h = map(spectrum[i], 0, 255, 0, height * 0.8);
    let hue = map(i, 0, spectrum.length, 0, 360);

🔬 This line maps audio strength (0–255) to bar height. What if you change height * 0.8 to height * 0.3 or height * 1.2? How much taller can bars grow?

    let h = map(spectrum[i], 0, 255, 0, height * 0.8);
function draw() {
  background(0, 0, 10, 20);
  
  let spectrum = fft.analyze();
  let vol = mic.getLevel();
  
  // Draw spectrum bars
  noStroke();
  for (let i = 0; i < spectrum.length; i += 4) {
    let x = map(i, 0, spectrum.length, 0, width);
    let h = map(spectrum[i], 0, 255, 0, height * 0.8);
    let hue = map(i, 0, spectrum.length, 0, 360);
    
    fill(hue, 80, 90, 80);
    rect(x, height - h, width / spectrum.length * 4 - 2, h);
  }
  
  // Center circle based on volume
  let size = map(vol, 0, 0.5, 50, 400);
  fill(frameCount % 360, 70, 90, 50);
  ellipse(width / 2, height / 2, size);
  
  // Instructions
  fill(0, 0, 100);
  textSize(14);
  textAlign(CENTER, TOP);
  text('Click to enable audio • Make some noise!', width / 2, 20);
}
Line-by-line explanation (17 lines)

🔧 Subcomponents:

initialization Audio Analysis let spectrum = fft.analyze(); let vol = mic.getLevel();

Gets the current frequency spectrum (array of 1024 values) and the overall volume level (0–1) from the microphone

for-loop Spectrum Bar Loop for (let i = 0; i < spectrum.length; i += 4) {

Loops through every 4th frequency value (to reduce detail and improve performance) and draws a bar for each

calculation Bar Positioning and Coloring let x = map(i, 0, spectrum.length, 0, width); let h = map(spectrum[i], 0, 255, 0, height * 0.8); let hue = map(i, 0, spectrum.length, 0, 360);

Maps frequency array indices to bar positions, maps frequency values (0–255) to bar heights, and assigns hue based on frequency position

calculation Volume-Based Circle let size = map(vol, 0, 0.5, 50, 400); fill(frameCount % 360, 70, 90, 50); ellipse(width / 2, height / 2, size);

Maps volume level (0–0.5) to a circle diameter that pulses at the center, with hue that cycles every frame

background(0, 0, 10, 20);
Draws a nearly black background (hue doesn't matter, saturation 0%, brightness 10%, alpha 20%) each frame—the low alpha creates a fade trail effect
let spectrum = fft.analyze();
Calls the FFT analyzer to break the current audio into 1024 frequency buckets, returning an array where each value is the strength (0–255) of that frequency band
let vol = mic.getLevel();
Gets the overall loudness of the microphone input as a number between 0 (silent) and 1 (very loud)
noStroke();
Removes the outline stroke from all rectangles drawn next, so bars are filled solid without borders
for (let i = 0; i < spectrum.length; i += 4) {
Loops through every 4th frequency (starting at 0, skipping 3 each time) to draw fewer bars for a cleaner look and better performance
let x = map(i, 0, spectrum.length, 0, width);
Converts the frequency index (0–1024) to a pixel position across the canvas width—low frequencies appear on the left, high on the right
let h = map(spectrum[i], 0, 255, 0, height * 0.8);
Converts the frequency strength (0–255) to a bar height from 0 to 80% of canvas height—louder frequencies make taller bars
let hue = map(i, 0, spectrum.length, 0, 360);
Assigns a hue value to this bar based on its position in the spectrum: 0 (red) on the left to 360 (red again) on the right, cycling through all colors
fill(hue, 80, 90, 80);
Sets the fill color in HSB mode: the calculated hue, 80% saturation (vibrant), 90% brightness (bright), 80% alpha (semi-transparent)
rect(x, height - h, width / spectrum.length * 4 - 2, h);
Draws a rectangle from the bottom of the canvas upward: x is left position, height - h is the top (so bars grow upward), width is calculated, h is the height
let size = map(vol, 0, 0.5, 50, 400);
Maps the volume level (0–0.5) to a circle diameter from 50 to 400 pixels—silent is tiny, loud is large
fill(frameCount % 360, 70, 90, 50);
Sets the circle color: hue cycles from 0–360 every 360 frames (creating a slow color rotation), saturation 70%, brightness 90%, alpha 50% (semi-transparent)
ellipse(width / 2, height / 2, size);
Draws a circle at the canvas center with the calculated size diameter
fill(0, 0, 100);
Sets the text color to white (hue irrelevant when saturation is 0, brightness 100%)
textSize(14);
Sets the font size to 14 pixels for the instruction text
textAlign(CENTER, TOP);
Aligns text horizontally center and vertically to the top, so the instruction text sits nicely at the top of the canvas
text('Click to enable audio • Make some noise!', width / 2, 20);
Draws the instruction text centered at x position (width/2) and 20 pixels from the top

windowResized()

windowResized() is a special p5.js function that runs automatically whenever the browser window size changes. Without it, the canvas would stay at its original size. By calling resizeCanvas(), the visualization adapts gracefully to any screen size.

function windowResized() {
  resizeCanvas(windowWidth, windowHeight);
}
Line-by-line explanation (1 lines)
resizeCanvas(windowWidth, windowHeight);
When the browser window is resized, this function updates the canvas dimensions to match the new window size, so the visualization always fills the screen

📦 Key Variables

mic p5.AudioIn object

Stores the microphone input object that captures audio from the user's device and provides the getLevel() function for volume

let mic = new p5.AudioIn();
fft p5.FFT object

Stores the FFT analyzer that breaks audio into 1024 frequency bands and provides the analyze() function for spectral data

let fft = new p5.FFT();
spectrum array of numbers

Holds the result of fft.analyze()—an array of 1024 values (0–255) representing the strength of each frequency band in the current audio frame

let spectrum = fft.analyze();
vol number

Stores the overall volume level from the microphone, ranging from 0 (silent) to 1 (very loud), used to control the circle pulse size

let vol = mic.getLevel();
x number

Stores the horizontal pixel position of each spectrum bar, calculated by mapping the frequency index across the canvas width

let x = map(i, 0, spectrum.length, 0, width);
h number

Stores the height of each spectrum bar in pixels, calculated by mapping the frequency strength (0–255) to a canvas height range

let h = map(spectrum[i], 0, 255, 0, height * 0.8);
hue number

Stores the color (0–360 in HSB mode) for each bar, cycling from red through the rainbow based on frequency position

let hue = map(i, 0, spectrum.length, 0, 360);
size number

Stores the diameter of the pulsing center circle in pixels, mapped from the microphone volume level

let size = map(vol, 0, 0.5, 50, 400);

🔧 Potential Improvements (4)

Here are some ways this code could be enhanced:

BUG draw() spectrum bar loop

The bar width calculation (width / spectrum.length * 4 - 2) doesn't account for the step size, causing bars to not align perfectly and leave gaps when i += 4 is changed

💡 Calculate bar width relative to the actual loop step: let barWidth = (width / (spectrum.length / 4)) - 2; or store the step (let step = 4) and use width / (spectrum.length / step) - 2

PERFORMANCE draw() background and fill calls

Calling background() and fill() with HSB values every frame is correct, but the semi-transparent background (alpha 20%) can cause jank on very slow devices if many bars are drawn

💡 Consider using requestAnimationFrame-based timing or reducing the loop step further (i += 8) on slower devices, or implement a frame-skip system

STYLE setup() and draw()

Magic numbers are scattered throughout (0.8, 50, 400, 360, 80, 90, 20, 14)—changing the visualization requires hunting through multiple lines

💡 Define these as named constants at the top: const BAR_HEIGHT_SCALE = 0.8; const MIN_CIRCLE = 50; const MAX_CIRCLE = 400; const SPECTRUM_STEP = 4; const BG_ALPHA = 20;

FEATURE draw()

The microphone level threshold (0.5 in the map function) is hardcoded, so very quiet rooms may have a tiny circle and loud environments may max out at 400 pixels—no adaptation

💡 Implement a simple peak detection: track the max volume seen in the last second and use it as a dynamic scaling reference instead of a fixed 0.5

🔄 Code Flow

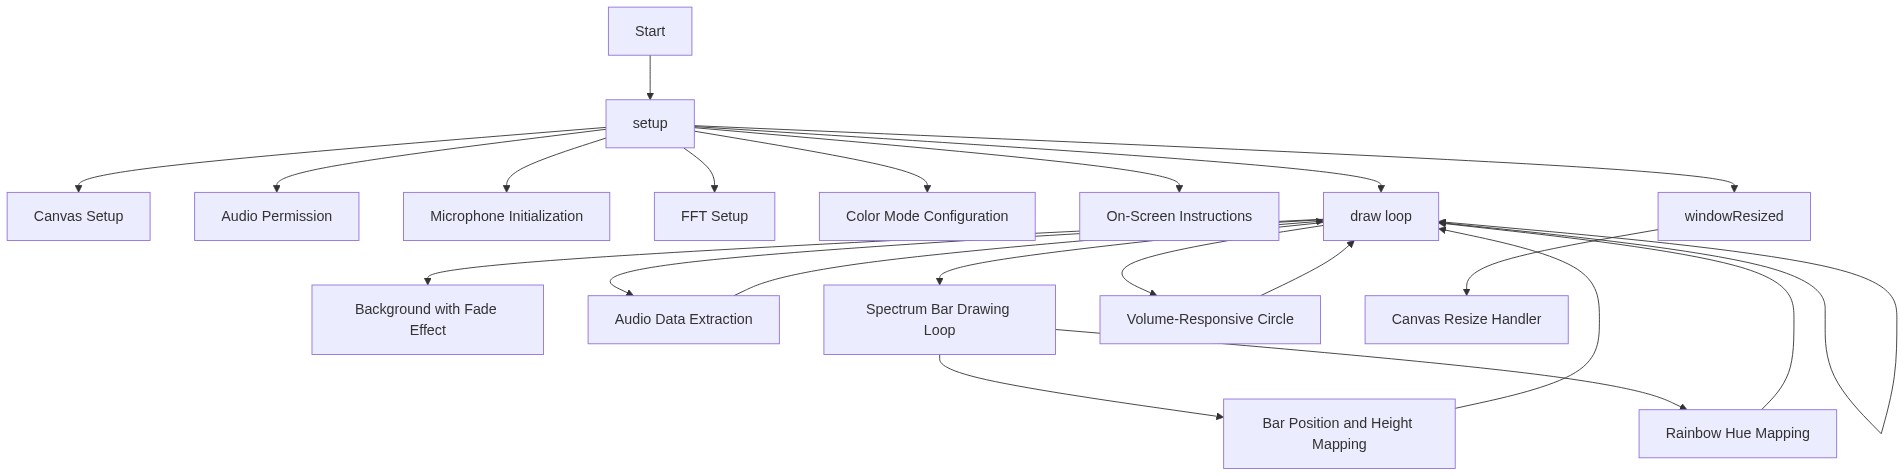
Code flow showing setup, draw, windowresized

💡 Click on function names in the diagram to jump to their code

graph TD start[Start] --> setup[setup] setup --> audio-input-setup[audio-input-setup] setup --> color-mode-setup[color-mode-setup] setup --> draw[draw loop] click setup href "#fn-setup" click audio-input-setup href "#sub-audio-input-setup" click color-mode-setup href "#sub-color-mode-setup" draw --> audio-analysis[audio-analysis] draw --> spectrum-loop[spectrum-loop] draw --> circle-pulse[circle-pulse] draw --> windowresized[windowresized] click draw href "#fn-draw" click audio-analysis href "#sub-audio-analysis" click spectrum-loop href "#sub-spectrum-loop" click circle-pulse href "#sub-circle-pulse" spectrum-loop --> bar-drawing[bar-drawing] bar-drawing --> spectrum-loop click bar-drawing href "#sub-bar-drawing"

❓ Frequently Asked Questions

What visual effects does the Audio Reactive sensor sketch produce?

The sketch generates colorful spectrum bars that react to audio input and a central circle whose size changes based on the detected volume.

How can users interact with the Audio Reactive sensor sketch?

Users can interact by clicking to enable audio input and then making noise to see the visual effects respond to their sound.

What creative coding techniques are demonstrated in this p5.js sketch?

This sketch demonstrates audio analysis using the Fast Fourier Transform (FFT) and visual mapping of audio data to graphical elements.

Preview

Audio Reactive sensor - p5.js creative coding sketch preview
Sketch Preview
Code flow diagram showing the structure of Audio Reactive sensor - Code flow showing setup, draw, windowresized
Code Flow Diagram