invest in CORBUN does weird webs (game)

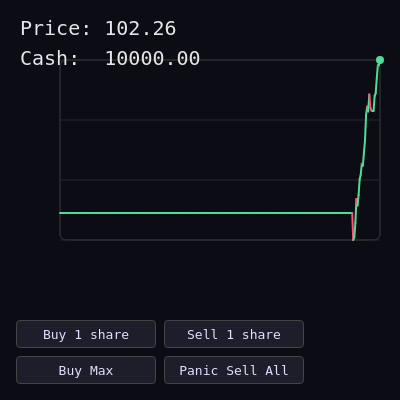
This sketch simulates a stock trading game where you buy and sell shares of the fictional CORBUN stock. A glowing price chart updates in real-time with random price movements, and buttons let you trade shares and watch your portfolio value change instantly.

🧪 Try This!

Experiment with the code by making these changes:

  1. Make the chart more volatile — Higher volatility makes the price swing wildly, creating exciting moments and risky trades
  2. Make the stock trend upward strongly — Increase the drift to create a bullish bias—prices creep up over time and you can profit from hodling
  3. Speed up price updates — Lower the modulo value to update the price more frequently, creating faster-paced gameplay
  4. Show your portfolio value on screen — Add a third line to the HUD displaying total wealth (cash + shares × price)
  5. Invert the chart colors — Red for up moves, green for down moves—creates a bearish feeling
  6. Make the background less dark — Change the background color from almost black to a lighter shade for a different mood
Prefer the full editor? Open it there →

📖 About This Sketch

This sketch creates a playable stock trading game centered on the fictional CORBUN ticker. A green-and-red price chart animates on a dark sci-fi interface, updating roughly six times per second as the price performs a random walk with an upward drift. The real appeal is that you can click buttons to buy shares, sell shares, go all-in, or panic-dump your entire position—and watch your cash and portfolio react instantly. It teaches you how to wire UI buttons to game logic, animate streaming data, and build a complete interactive experience.

The code is split into three sections: price simulation (a random walk with volatility), trading logic (buy, sell, and portfolio calculations), and drawing (a real-time chart and heads-up display). By studying it you will learn how to create responsive buttons with p5.js, scale and normalize data for visualization, draw dynamic line charts, and connect user input to a game state that updates every frame.

⚙️ How It Works

  1. When the sketch loads, setup() creates a full-window canvas, initializes the CORBUN price at 100, fills a priceHistory array with 300 copies of that starting price, and creates four buttons for trading.
  2. Every frame, draw() clears the background and checks if it's time to update the price (every 10 frames, roughly 6 times per second).
  3. updatePrice() performs a random walk: it generates a random number from a normal distribution, multiplies it by volatility, adds a tiny upward drift, and multiplies the current price by that factor. The new price is pushed into priceHistory, and old entries are removed to keep exactly 300 points.
  4. When you click a button, one of four trading functions runs: buyShares() reduces cash and increases shares, sellShares() does the opposite, buyMax() buys as many shares as your cash allows, and sellAll() converts all shares back to cash.
  5. drawChart() scales the price history to fit the screen, draws horizontal grid lines, and renders the price line one segment at a time—green for price increases, red for decreases. A glowing circle highlights the most recent price point.
  6. drawHUD() displays the current price and cash balance in the top-left corner. The entire UI resizes when the window resizes thanks to windowResized().

🎓 Concepts You'll Learn

Interactive buttonsGame state managementRandom walk simulationReal-time data visualizationNormalization and scalingConditional color rendering

📝 Code Breakdown

setup()

setup() runs once when the sketch first loads. It initializes your data structures (priceHistory), prepares the canvas, and builds the UI. Any setup work that should happen only once goes here.

function setup() {
  createCanvas(windowWidth, windowHeight);
  textFont('monospace');

  // Initialize history with a flat line
  for (let i = 0; i < maxHistory; i++) {
    priceHistory.push(price);
  }

  createUI();
}
Line-by-line explanation (5 lines)

🔧 Subcomponents:

for-loop Price history initialization for (let i = 0; i < maxHistory; i++) { priceHistory.push(price); }

Fills the priceHistory array with 300 copies of the starting price so the chart starts with a flat baseline

createCanvas(windowWidth, windowHeight);
Creates a canvas that fills the entire browser window, making the game fullscreen
textFont('monospace');
Sets the font to monospace for a classic stock-ticker look
for (let i = 0; i < maxHistory; i++) {
Loops 300 times to pre-fill the price history
priceHistory.push(price);
Adds the starting price (100) to the history array each loop iteration
createUI();
Calls the function that creates and styles all four trading buttons
draw()

draw() is the heartbeat of the sketch—it runs 60 times per second and is where all animation happens. The frameCount throttle (% 10) prevents price updates from happening too fast to see, a common pattern in games.

🔬 This is the core game loop. What happens if you comment out the drawChart() line? Where does the price data go if you can't see the chart?

  background(12, 12, 20);

  // Update price at a slower rate (about 6 times per second)
  if (frameCount % 10 === 0) {
    updatePrice();
  }

  drawChart();
  drawHUD();
function draw() {
  background(12, 12, 20);

  // Update price at a slower rate (about 6 times per second)
  if (frameCount % 10 === 0) {
    updatePrice();
  }

  drawChart();
  drawHUD();
}
Line-by-line explanation (5 lines)

🔧 Subcomponents:

conditional Price update throttle if (frameCount % 10 === 0) { updatePrice(); }

Only updates the price every 10 frames (about 6 times per second at 60 FPS) instead of every single frame, making price changes visible to the eye

background(12, 12, 20);
Clears the entire canvas with a very dark blue-black color, erasing the previous frame
if (frameCount % 10 === 0) {
Checks if the current frame number is evenly divisible by 10 (true on frames 0, 10, 20, etc.)
updatePrice();
Runs the price simulation, which generates a new price and adds it to the history
drawChart();
Draws the entire price line chart with grid lines and the glowing endpoint
drawHUD();
Draws the text displaying current price and cash balance

updatePrice()

This function implements a geometric random walk with drift—the classic model for stock prices in finance. randomGaussian() is key: it gives bell-curve randomness instead of uniform randomness, making the price movements feel natural and realistic.

function updatePrice() {
  // Random walk with a tiny upward drift
  const randomShock = randomGaussian(0, 1);    // normal distribution
  const drift = 0.0005;                        // small bias upwards
  const volatility = 0.01;                     // overall volatility

  const changeFactor = 1 + drift + randomShock * volatility * 0.2;
  price *= changeFactor;

  // Floor price so it never goes to zero
  if (price < 1) price = 1;

  priceHistory.push(price);
  if (priceHistory.length > maxHistory) {
    priceHistory.shift();
  }
}
Line-by-line explanation (9 lines)

🔧 Subcomponents:

calculation Random walk price change const changeFactor = 1 + drift + randomShock * volatility * 0.2;

Combines a constant upward bias (drift) with random noise (randomShock × volatility) to create realistic stock price movement

conditional Price floor if (price < 1) price = 1;

Prevents the price from ever reaching zero, which would break the game

conditional History size limit if (priceHistory.length > maxHistory) { priceHistory.shift(); }

Keeps the priceHistory array at exactly 300 points by removing the oldest entry when a new one is added

const randomShock = randomGaussian(0, 1);
Generates a random number from a normal (bell curve) distribution centered at 0 with a standard deviation of 1—most values are between -3 and +3
const drift = 0.0005;
A tiny constant that biases the price upward by 0.05% per update, making CORBUN trend bullish over time
const volatility = 0.01;
Controls how wild the random swings are—0.01 means price swings up to ±1% per update
const changeFactor = 1 + drift + randomShock * volatility * 0.2;
Multiplies the drift and scaled randomness together: starting at 1 (no change), add drift (always positive), then add/subtract randomness (mostly between -0.002 and +0.002)
price *= changeFactor;
Multiplies the current price by the change factor—if changeFactor is 1.001, price grows by 0.1%; if 0.999, it shrinks by 0.1%
if (price < 1) price = 1;
Safety check: if the price ever falls below 1 (due to extreme randomness), clamp it to 1 so it never becomes zero or negative
priceHistory.push(price);
Adds the new price to the end of the priceHistory array so it appears on the chart
if (priceHistory.length > maxHistory) {
Checks if the history has grown beyond 300 entries
priceHistory.shift();
Removes the oldest price (first entry) from the array, keeping only the most recent 300 prices for display

buyShares(n)

buyShares() is a simple trade function that trades cash for shares at the current market price. The if-statement prevents you from going broke, a basic constraint that keeps the game playable.

function buyShares(n) {
  const cost = price * n;
  if (cost <= cash) {
    cash -= cost;
    shares += n;
  }
}
Line-by-line explanation (4 lines)

🔧 Subcomponents:

conditional Affordability check if (cost <= cash) {

Only allows the purchase if you have enough cash, preventing negative cash balances

const cost = price * n;
Calculates the total cost: current price per share times the number of shares you want to buy
if (cost <= cash) {
Checks if you have enough cash to afford the purchase
cash -= cost;
Subtracts the cost from your cash balance
shares += n;
Adds the purchased shares to your holdings

sellShares(n)

sellShares() is the inverse of buyShares(): it trades shares for cash at the current price. Like buying, it has a guard clause (the if-statement) to ensure you only sell what you own.

function sellShares(n) {
  if (n <= shares) {
    const proceeds = price * n;
    shares -= n;
    cash += proceeds;
  }
}
Line-by-line explanation (4 lines)

🔧 Subcomponents:

conditional Ownership check if (n <= shares) {

Only allows selling shares you actually own, preventing short selling

if (n <= shares) {
Checks if you own at least n shares before allowing the sale
const proceeds = price * n;
Calculates how much cash you get back: current price times the number of shares sold
shares -= n;
Reduces your share count
cash += proceeds;
Adds the sale proceeds to your cash balance

buyMax()

buyMax() is a convenience function: it calculates how many shares you can buy with your current cash and goes all-in. This is the 'YOLO button' that makes trading fun and risky.

function buyMax() {
  const maxShares = floor(cash / price);
  if (maxShares > 0) {
    buyShares(maxShares);
  }
}
Line-by-line explanation (3 lines)

🔧 Subcomponents:

calculation Maximum shares calculation const maxShares = floor(cash / price);

Divides available cash by the current price and rounds down to get the most shares you can afford as a whole number

const maxShares = floor(cash / price);
Divides your cash by the price and rounds down (floor) to get a whole number of shares you can afford
if (maxShares > 0) {
Only attempts to buy if you can actually afford at least 1 share
buyShares(maxShares);
Calls buyShares() with the maximum affordable quantity, spending all your cash (or nearly all, if there's a remainder)

sellAll()

sellAll() is the 'panic sell' button—it instantly liquidates your entire position into cash. It's the counterpart to buyMax() and creates the risk/reward tension in the game.

function sellAll() {
  if (shares > 0) {
    sellShares(shares);
  }
}
Line-by-line explanation (2 lines)
if (shares > 0) {
Checks that you own at least one share before attempting to sell
sellShares(shares);
Calls sellShares() with your entire share balance, converting all holdings to cash instantly

portfolioValue()

portfolioValue() computes your total wealth at any moment. It's not used in the current sketch but is ready for you to extend the game—display it, track losses, trigger game-over conditions, etc.

function portfolioValue() {
  return cash + shares * price;
}
Line-by-line explanation (1 lines)
return cash + shares * price;
Calculates total net worth by adding liquid cash to the market value of all shares owned (number of shares times current price)

createUI()

createUI() shows how to build interactive p5.js sketches: use p5's createButton() to spawn DOM elements, use mousePressed() to attach callbacks, and use .style() to apply CSS properties. This approach wires the UI directly to your game functions.

🔬 This loop styles every button identically. What happens if you add `b.style('font-size', '20px');` inside the loop? How about changing the background-color to something bright like '#ff0000' to panic the player?

  const buttons = [buy1Btn, sell1Btn, buyMaxBtn, sellAllBtn];
  for (let b of buttons) {
    b.style('font-family', 'monospace');
    b.style('font-size', '13px');
    b.style('padding', '6px 10px');
    b.style('border-radius', '4px');
    b.style('border', '1px solid #444');
    b.style('background-color', '#1e1e2a');
    b.style('color', '#e0e0ff');
    b.style('cursor', 'pointer');
  }
function createUI() {
  buy1Btn = createButton('Buy 1 share');
  buy1Btn.mousePressed(() => buyShares(1));

  sell1Btn = createButton('Sell 1 share');
  sell1Btn.mousePressed(() => sellShares(1));

  // CHANGED LABEL HERE
  buyMaxBtn = createButton('Buy Max');
  buyMaxBtn.mousePressed(buyMax);

  sellAllBtn = createButton('Panic Sell All');
  sellAllBtn.mousePressed(sellAll);

  // Basic button styling via p5.Element.style()
  const buttons = [buy1Btn, sell1Btn, buyMaxBtn, sellAllBtn];
  for (let b of buttons) {
    b.style('font-family', 'monospace');
    b.style('font-size', '13px');
    b.style('padding', '6px 10px');
    b.style('border-radius', '4px');
    b.style('border', '1px solid #444');
    b.style('background-color', '#1e1e2a');
    b.style('color', '#e0e0ff');
    b.style('cursor', 'pointer');
  }

  layoutUI();
}
Line-by-line explanation (8 lines)

🔧 Subcomponents:

for-loop Button creation loop buy1Btn = createButton('Buy 1 share'); buy1Btn.mousePressed(() => buyShares(1));

Creates a button and wires its click event to a function, establishing the connection between UI and game logic

for-loop Button styling loop for (let b of buttons) { b.style('font-family', 'monospace'); b.style('font-size', '13px'); b.style('padding', '6px 10px'); b.style('border-radius', '4px'); b.style('border', '1px solid #444'); b.style('background-color', '#1e1e2a'); b.style('color', '#e0e0ff'); b.style('cursor', 'pointer'); }

Applies CSS-style properties to all buttons to match the dark sci-fi theme

buy1Btn = createButton('Buy 1 share');
Creates an HTML button with the label 'Buy 1 share' and stores it in the global variable buy1Btn
buy1Btn.mousePressed(() => buyShares(1));
Registers a callback: when the button is clicked, the arrow function calls buyShares(1) to purchase one share
const buttons = [buy1Btn, sell1Btn, buyMaxBtn, sellAllBtn];
Creates an array of all four buttons so they can be styled in a loop
for (let b of buttons) {
Loops through each button in the array
b.style('font-family', 'monospace');
Sets the button font to monospace to match the stock-ticker aesthetic
b.style('background-color', '#1e1e2a');
Gives the button a dark background color matching the canvas theme
b.style('color', '#e0e0ff');
Sets the button text to a light purple-white color
layoutUI();
Calls the function that positions all buttons on the screen

layoutUI()

layoutUI() positions all buttons after sizing them, calculating positions relative to the window height so the layout adapts when the window resizes. This is called responsive design—the UI adapts to different screen sizes.

function layoutUI() {
  const margin = 16;
  const btnWidth = 140;
  const btnHeight = 28;

  const row1Y = height - btnHeight - margin;           // bottom row
  const row2Y = row1Y - btnHeight - 8;                 // row above

  buy1Btn.size(btnWidth, btnHeight);
  sell1Btn.size(btnWidth, btnHeight);
  buyMaxBtn.size(btnWidth, btnHeight);
  sellAllBtn.size(btnWidth, btnHeight);

  // Row 2 (top of the two rows)
  buy1Btn.position(margin, row2Y);
  sell1Btn.position(margin + btnWidth + 8, row2Y);

  // Row 1 (bottom)
  buyMaxBtn.position(margin, row1Y);
  sellAllBtn.position(margin + btnWidth + 8, row1Y);
}
Line-by-line explanation (8 lines)

🔧 Subcomponents:

calculation Row position calculation const row1Y = height - btnHeight - margin; const row2Y = row1Y - btnHeight - 8;

Calculates the Y positions for two rows of buttons anchored to the bottom of the window, leaving margin for padding

const margin = 16;
Sets padding from the window edges to 16 pixels
const btnWidth = 140;
All buttons are 140 pixels wide
const btnHeight = 28;
All buttons are 28 pixels tall
const row1Y = height - btnHeight - margin;
Places the bottom row 16 pixels from the bottom edge of the window
const row2Y = row1Y - btnHeight - 8;
Places the second row one button height plus 8 pixels of gap above the bottom row
buy1Btn.size(btnWidth, btnHeight);
Resizes the button to 140×28 pixels
buy1Btn.position(margin, row2Y);
Positions the button 16 pixels from the left and at the calculated Y position of row 2
sell1Btn.position(margin + btnWidth + 8, row2Y);
Places the sell button to the right of the buy button with an 8-pixel gap between them

drawChart()

drawChart() is the visual centerpiece: it normalizes price data (scaling a large range of values into a 0–1 range), maps that normalized data to screen coordinates, and draws it with dynamic colors. The techniques here—normalization, mapping, and conditional coloring—are fundamental to data visualization.

🔬 This is the color logic of the chart. What happens if you swap the colors—put red for up moves and green for down moves? Or try cyan/magenta instead of green/red? How does it change the emotional feel of watching the chart?

    if (priceHistory[i] >= priceHistory[i - 1]) {
      // Up move → green
      stroke(80, 220, 150);
    } else {
      // Down move → red
      stroke(255, 80, 120);
    }
function drawChart() {
  const left = 60;
  const right = width - 20;
  const top = 60;
  const bottom = height - 160; // leave room for text + buttons

  // Frame for the chart
  push();
  stroke(60);
  strokeWeight(1);
  noFill();
  rect(left, top, right - left, bottom - top, 6);
  pop();

  if (priceHistory.length < 2) return;

  // Find min & max in history to scale chart
  let minPrice = Infinity;
  let maxPrice = -Infinity;
  for (let p of priceHistory) {
    if (p < minPrice) minPrice = p;
    if (p > maxPrice) maxPrice = p;
  }
  if (minPrice === maxPrice) {
    minPrice *= 0.9;
    maxPrice *= 1.1;
  }

  // Horizontal grid lines (3)
  push();
  stroke(40);
  strokeWeight(1);
  for (let i = 0; i <= 3; i++) {
    const y = lerp(bottom, top, i / 3);
    line(left, y, right, y);
  }
  pop();

  // Price line: green when price goes up, red when it goes down
  push();
  strokeWeight(2);
  noFill();

  for (let i = 1; i < priceHistory.length; i++) {
    const x1 = map(i - 1, 0, priceHistory.length - 1, left, right);
    const x2 = map(i, 0, priceHistory.length - 1, left, right);

    const norm1 = (priceHistory[i - 1] - minPrice) / (maxPrice - minPrice);
    const norm2 = (priceHistory[i] - minPrice) / (maxPrice - minPrice);

    const y1 = lerp(bottom, top, norm1);
    const y2 = lerp(bottom, top, norm2);

    if (priceHistory[i] >= priceHistory[i - 1]) {
      // Up move → green
      stroke(80, 220, 150);
    } else {
      // Down move → red
      stroke(255, 80, 120);
    }
    line(x1, y1, x2, y2);
  }

  // Last point highlight, same color as last move
  const lastIndex = priceHistory.length - 1;
  const prevIndex = lastIndex - 1;

  const lastX = map(lastIndex, 0, priceHistory.length - 1, left, right);
  const lastNorm = (priceHistory[lastIndex] - minPrice) / (maxPrice - minPrice);
  const lastY = lerp(bottom, top, lastNorm);

  if (priceHistory[lastIndex] < priceHistory[prevIndex]) {
    fill(255, 80, 120); // red if last move was down
  } else {
    fill(80, 220, 150); // green otherwise
  }
  noStroke();
  circle(lastX, lastY, 8);

  pop();
}
Line-by-line explanation (16 lines)

🔧 Subcomponents:

calculation Chart frame drawing rect(left, top, right - left, bottom - top, 6);

Draws a rounded rectangle border defining the chart area

for-loop Min/max price calculation for (let p of priceHistory) { if (p < minPrice) minPrice = p; if (p > maxPrice) maxPrice = p; }

Scans the entire price history to find the lowest and highest prices so they can be scaled to fit the chart height

for-loop Horizontal grid lines for (let i = 0; i <= 3; i++) { const y = lerp(bottom, top, i / 3); line(left, y, right, y); }

Draws 3 evenly spaced horizontal lines across the chart for reference

for-loop Price line drawing for (let i = 1; i < priceHistory.length; i++) {

Loops through all price points and draws a line segment between each pair, changing color based on whether the price went up or down

const left = 60;
The chart's left edge is 60 pixels from the left side of the window
const right = width - 20;
The chart's right edge is 20 pixels from the right side of the window
const top = 60;
The chart's top edge is 60 pixels down from the top of the window
const bottom = height - 160;
The chart's bottom edge is 160 pixels up from the bottom, leaving room for text and buttons
stroke(60); strokeWeight(1); noFill(); rect(left, top, right - left, bottom - top, 6);
Draws a dark gray rounded rectangle border around the chart area
if (priceHistory.length < 2) return;
Exits early if there aren't enough price points to draw lines—prevents errors
for (let p of priceHistory) { if (p < minPrice) minPrice = p; if (p > maxPrice) maxPrice = p; }
Loops through all prices to find the minimum and maximum, needed to scale the chart
if (minPrice === maxPrice) { minPrice *= 0.9; maxPrice *= 1.1; }
If all prices are identical (flat line), expand the range slightly to avoid division by zero errors when normalizing
for (let i = 0; i <= 3; i++) { const y = lerp(bottom, top, i / 3); line(left, y, right, y); }
Draws 3 horizontal reference lines: bottom (i=0), middle (i=1.5), and top (i=3)
for (let i = 1; i < priceHistory.length; i++) {
Loops starting at 1 so you can draw a line FROM the previous point TO the current point
const x1 = map(i - 1, 0, priceHistory.length - 1, left, right);
Maps the previous price's index (0 to 299) to an X coordinate on the screen (left to right)
const norm1 = (priceHistory[i - 1] - minPrice) / (maxPrice - minPrice);
Normalizes the previous price to a value between 0 (minimum price on chart) and 1 (maximum price on chart)
const y1 = lerp(bottom, top, norm1);
Converts the normalized price (0–1) to a Y coordinate on the screen (bottom to top)
if (priceHistory[i] >= priceHistory[i - 1]) { stroke(80, 220, 150); } else { stroke(255, 80, 120); }
Colors the line green if price increased, red if it decreased
line(x1, y1, x2, y2);
Draws a line segment from the previous point to the current point
circle(lastX, lastY, 8);
Draws a glowing circle (8 pixels diameter) at the most recent price point to highlight it

drawHUD()

drawHUD() displays heads-up display (HUD) information—the price and cash balance. It uses template literals with toFixed(2) to format numbers neatly. This is a great place to add more stats like share count or total portfolio value.

function drawHUD() {
  push();
  fill(230);
  noStroke();
  textAlign(LEFT, TOP);

  // Only show price and cash
  textSize(20);
  text(`Price: ${price.toFixed(2)}`, 20, 20);
  text(`Cash:  ${cash.toFixed(2)}`, 20, 50);

  pop();
}
Line-by-line explanation (6 lines)
fill(230);
Sets the text color to light gray (RGB 230,230,230)
noStroke();
Removes any outline around the text
textAlign(LEFT, TOP);
Aligns text so the starting position is the top-left corner of the text (easier for positioning)
textSize(20);
Sets font size to 20 pixels
text(`Price: ${price.toFixed(2)}`, 20, 20);
Draws the current price rounded to 2 decimal places at position (20, 20)
text(`Cash: ${cash.toFixed(2)}`, 20, 50);
Draws your current cash balance rounded to 2 decimal places at position (20, 50)

windowResized()

windowResized() is a p5.js special function that fires automatically when the browser window is resized. By calling resizeCanvas() and layoutUI(), the sketch adapts to any screen size—a key part of responsive design.

function windowResized() {
  resizeCanvas(windowWidth, windowHeight);
  layoutUI();
}
Line-by-line explanation (2 lines)
resizeCanvas(windowWidth, windowHeight);
Resizes the p5.js canvas to match the new window dimensions when the user resizes the browser
layoutUI();
Recalculates and reapplies button positions to adapt to the new window size

📦 Key Variables

price number

Stores the current market price of CORBUN stock, updated every 10 frames by updatePrice()

let price = 100;
priceHistory array

Stores the last 300 prices as a time series for drawing the chart

let priceHistory = [];
maxHistory number

Maximum length of the priceHistory array—when it exceeds this, old prices are removed

let maxHistory = 300;
cash number

Your liquid cash balance in dollars; increased by selling shares, decreased by buying shares

let cash = 10000;
shares number

Your current share count of CORBUN stock; increased by buying, decreased by selling

let shares = 0;
buy1Btn object

A p5.js button element that triggers buyShares(1) when clicked

let buy1Btn;
sell1Btn object

A p5.js button element that triggers sellShares(1) when clicked

let sell1Btn;
buyMaxBtn object

A p5.js button element that triggers buyMax() when clicked, spending all available cash

let buyMaxBtn;
sellAllBtn object

A p5.js button element that triggers sellAll() when clicked, liquidating all shares

let sellAllBtn;

🔧 Potential Improvements (6)

Here are some ways this code could be enhanced:

FEATURE drawHUD()

The HUD only shows price and cash, not shares or total portfolio value

💡 Add `text('Shares: ' + shares, 20, 80)` and call portfolioValue() to display total net worth. This gives players full information to make trading decisions.

BUG drawChart()

If minPrice equals maxPrice (all prices identical), the code multiplies by 0.9 and 1.1 but doesn't prevent division by zero if they remain equal

💡 Add an epsilon check: `const range = maxPrice - minPrice; if (range < 0.01) maxPrice = minPrice + 1;` to guarantee a safe denominator.

STYLE updatePrice()

Magic numbers (0.0005 drift, 0.01 volatility, 0.2 scaling) are hardcoded and not easy to tune

💡 Create global constants like `const PRICE_DRIFT = 0.0005;` at the top of the file so these values are centralized and easier to adjust.

FEATURE drawChart() and drawHUD()

There is no win condition, loss condition, or score tracking

💡 Track a starting portfolio value and display P&L (profit/loss) or percentage gain. Add a condition to pause the game if the player runs out of cash.

PERFORMANCE drawChart() minmax loop

Every frame, the code scans all 300 prices to find min/max even if they haven't changed

💡 Cache minPrice and maxPrice as global variables and only recalculate them when a new price is added, saving repeated computation each frame.

STYLE createUI()

Button styling code is repetitive (8 style() calls per loop iteration)

💡 Create a helper function like `styleButton(btn)` that applies all styles at once, reducing duplication and making future style changes easier.

🔄 Code Flow

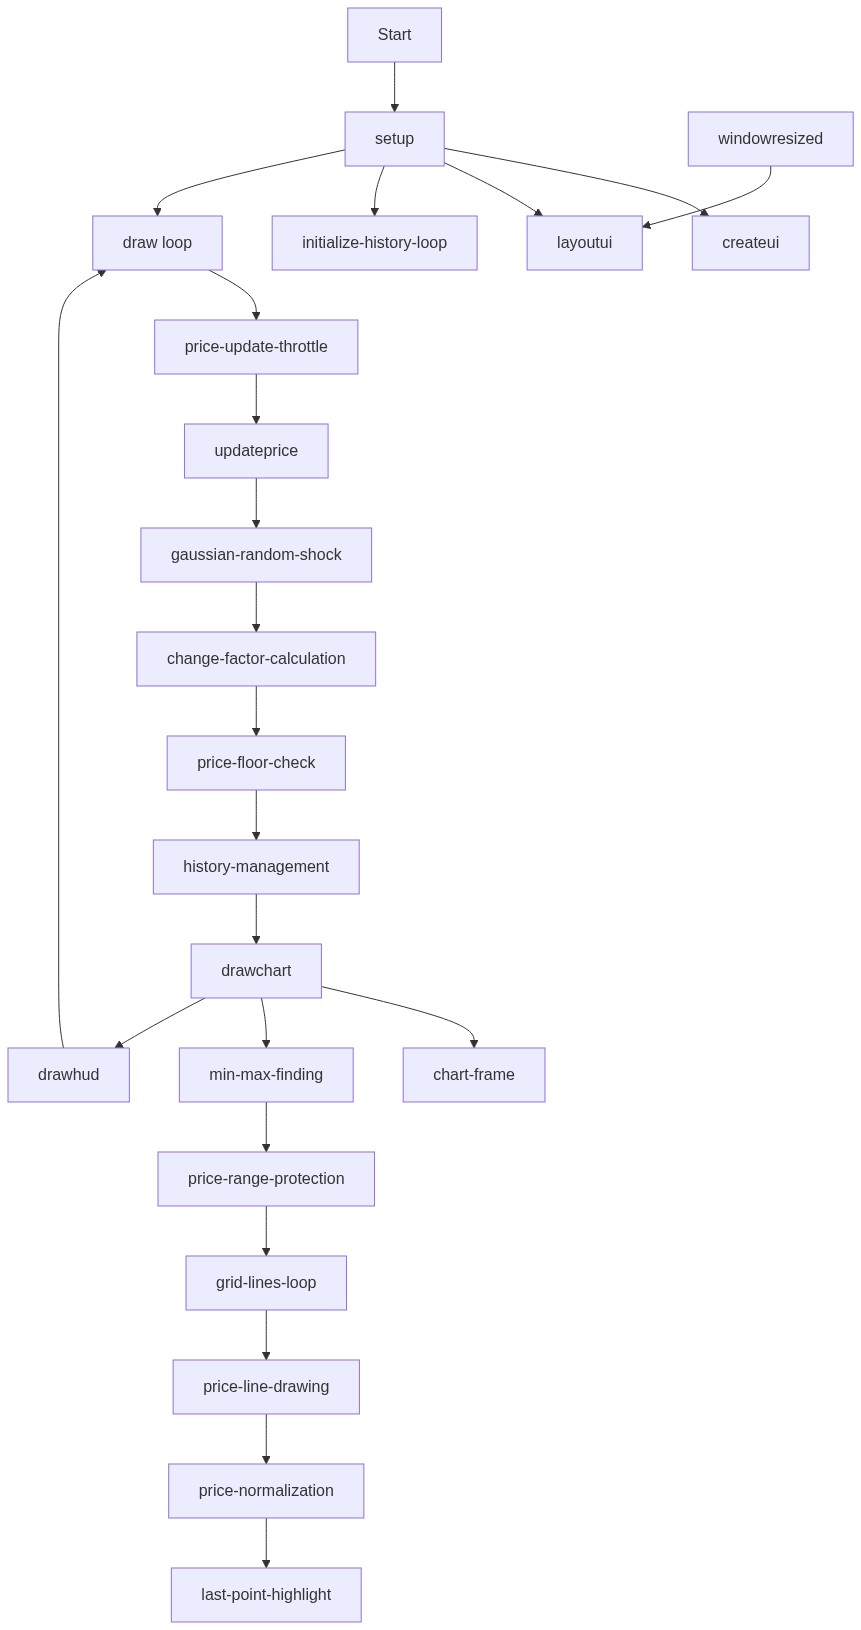
Code flow showing setup, draw, updateprice, buyshares, sellshares, buymax, sellall, portfoliovalue, createui, layoutui, drawchart, drawhud, windowresized

💡 Click on function names in the diagram to jump to their code

graph TD start[Start] --> setup[setup] setup --> createui[createUI] createui --> layoutui[layoutUI] layoutui --> draw[draw loop] draw --> price-update-throttle[Price Update Throttle] price-update-throttle --> updateprice[updatePrice] updateprice --> random-walk[Random Walk] random-walk --> price-floor[Price Floor] price-floor --> history-trim[History Trim] history-trim --> drawchart[drawChart] drawchart --> minmax-find[Min/Max Find] minmax-find --> grid-lines[Grid Lines] grid-lines --> price-line-loop[Price Line Loop] price-line-loop --> drawhud[drawHUD] drawhud --> draw click setup href "#fn-setup" click createui href "#fn-createui" click layoutui href "#fn-layoutui" click draw href "#fn-draw" click price-update-throttle href "#sub-price-update-throttle" click updateprice href "#fn-updateprice" click random-walk href "#sub-random-walk" click price-floor href "#sub-price-floor" click history-trim href "#sub-history-trim" click drawchart href "#fn-drawchart" click minmax-find href "#sub-minmax-find" click grid-lines href "#sub-grid-lines" click price-line-loop href "#sub-price-line-loop" draw --> history-init[History Init] history-init --> setup click history-init href "#sub-history-init" updateprice --> price-update-throttle price-update-throttle --> price-floor price-floor --> history-trim draw --> button-creation[Button Creation] button-creation --> button-styling[Button Styling] button-styling --> drawhud click button-creation href "#sub-button-creation" click button-styling href "#sub-button-styling" button-creation --> afford-check[Affordability Check] afford-check --> buyshares[buyShares] buyshares --> drawhud click afford-check href "#sub-afford-check" click buyshares href "#fn-buyshares" button-creation --> own-check[Ownership Check] own-check --> sellshares[sellShares] sellshares --> drawhud click own-check href "#sub-own-check" click sellshares href "#fn-sellshares" button-creation --> max-calc[Max Shares Calculation] max-calc --> buymax[buyMax] buymax --> drawhud click max-calc href "#sub-max-calc" click buymax href "#fn-buymax" button-creation --> sellall[sellAll] sellall --> drawhud click sellall href "#fn-sellall" windowresized[windowResized] --> resizeCanvas[Resize Canvas] resizeCanvas --> layoutui click windowresized href "#fn-windowresized"

❓ Frequently Asked Questions

What visual experience does the CORBUN 'does weird webs' sketch provide?

The sketch presents a glowing price line that snakes across a dark, sci-fi chart, dynamically illustrating the fluctuating value of CORBUN in real-time.

How can users interact with the CORBUN trading simulator?

Users can buy, sell, go all-in, or panic dump their shares using on-screen buttons, with their portfolio updating instantly based on their actions.

What creative coding concepts are showcased in this p5.js sketch?

The sketch demonstrates concepts of real-time data visualization through random price simulation, user interaction, and dynamic chart updating.

Preview

invest in CORBUN does weird webs (game) - p5.js creative coding sketch preview
Sketch Preview
Code flow diagram showing the structure of invest in CORBUN does weird webs (game) - Code flow showing setup, draw, updateprice, buyshares, sellshares, buymax, sellall, portfoliovalue, createui, layoutui, drawchart, drawhud, windowresized
Code Flow Diagram