
p5 storm chasing project (Remix)

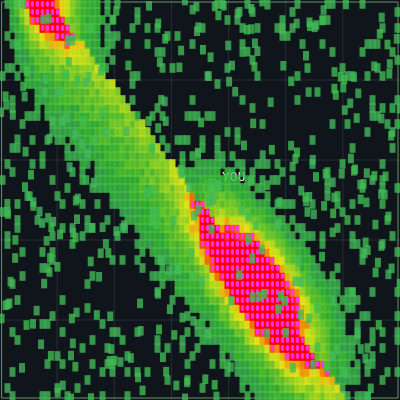
This sketch creates a TV-style National Weather Service radar map that simulates weather patterns across a region. It displays a dynamic southwest-to-northeast band of rain with a stratiform shield, tornado markers, and a Providence, KY location indicator that regenerates every few seconds or when clicked.

🧪 Try This!

Experiment with the code by making these changes:

  1. Speed up the radar refresh — Reduce the auto-refresh interval so the radar regenerates more frequently—storms will evolve faster
  2. Make the storm band much wider — Increase the bandWidth value to stretch the squall line across a larger area of the map
  3. Rotate the storm line to run north-south — Change the front angle from southwest-northeast (-45°) to north-south (90°) to shift the storm orientation
  4. Add way more background drizzle texture — Increase the drizzle multiplier to scatter much more light rain specks across the entire map
  5. Make tornadoes much more common — Lower the rarity threshold so tornado warnings appear in ~70% of radar updates instead of ~30%
  6. Change the city marker to a different location — Modify the Providence coordinates to show a different city—try (-88.0, 38.0) for a spot to the west
Prefer the full editor? Open it there →

📖 About This Sketch

This sketch animates a full-screen weather radar display inspired by broadcast meteorology. It generates a southwest-to-northeast squall line of rain with a broader stratiform shield using trigonometric field calculations, renders radar echoes with a realistic green-to-red reflectivity color ramp, and places tornado markers on the strongest reflectivity cores. The visual result looks like a live NWS composite radar—complete with grid lines, a Providence, KY location marker, and rotating tornado symbols that spin with frameCount.

The code is organized into weather generation (using normalized coordinates and rotation math), visual rendering (radar echoes with HSB color mapping, tornado symbols, and map overlays), and interaction handlers (click or tap to regenerate, auto-refresh every 3 seconds, responsive window resize). By studying it you will learn coordinate transformation, field-based procedural generation, color mapping for data visualization, and how to layer multiple visual systems into a cohesive simulation.

⚙️ How It Works

  1. When the sketch loads, setup() creates a full-screen canvas, sets HSB color mode for easy radar color ramps, and starts an auto-refresh timer that regenerates weather every 3 seconds.
  2. generateWeather() creates a grid of cells across the canvas and calculates a weather field by rotating coordinates to align with a southwest-to-northeast front line, computing field intensity along and perpendicular to that line, adding a stratiform region on one side, and storing the result in an echoes array with x, y, and intensity values.
  3. draw() paints a dark bluish radar background, renders grid lines and the Providence marker using lonLatToScreen() to map geographic coordinates to screen pixels, then draws each echo as a small rectangle colored by its intensity using an NWS-style green-yellow-red ramp.
  4. After echoes are drawn, generateTornadoesFromEchoes() selects the strongest echoes (intensity > 0.9) as tornado candidates, randomly picks rare tornado locations with minimum separation, and stores them in the tornadoes array.
  5. drawTornados() renders each tornado as a red circle with a rotating triangle 'funnel' and a TORNADO label, updating the rotation angle each frame with frameCount * 0.15 to create spinning motion.
  6. Clicking or touching calls generateWeather() and redraw(), instantly refreshing the radar. The auto-refresh timer does the same every 3000 milliseconds, and windowResized() regenerates the field when the window size changes.

🎓 Concepts You'll Learn

Coordinate transformation and rotationField-based procedural generationHSB color mapping for data visualizationGrid-based spatial partitioningProcedural spline and pattern generationInteractive state regeneration

📝 Code Breakdown

setup()

setup() runs once when the sketch starts. Here we create the canvas, configure p5.js color mode, disable automatic looping so we save CPU, and set up the auto-refresh timer. The noLoop()/redraw() pattern is useful for simulations that should only update on demand.

function setup() {
  createCanvas(windowWidth, windowHeight);
  colorMode(HSB, 360, 100, 100, 100);
  textFont('monospace');
  textSize(13);

  generateWeather();
  noLoop(); // draw only when we explicitly ask for it

  // Set up automatic radar refresh
  autoRefreshTimer = setInterval(() => {
    generateWeather();
    redraw(); // re-render once
  }, autoRefreshMs);
}
Line-by-line explanation (7 lines)

🔧 Subcomponents:

configuration HSB color mode colorMode(HSB, 360, 100, 100, 100);

Switches from RGB to HSB so we can easily map intensity values to hue (green→red spectrum)

configuration Disable automatic looping noLoop(); // draw only when we explicitly ask for it

Stops p5.js from calling draw() every frame—we use redraw() only when weather changes

initialization Auto-refresh timer autoRefreshTimer = setInterval(() => { generateWeather(); redraw(); // re-render once }, autoRefreshMs);

Sets up a JavaScript interval that regenerates the weather every autoRefreshMs milliseconds

createCanvas(windowWidth, windowHeight);
Creates a canvas that fills the entire browser window so the radar takes up the full screen
colorMode(HSB, 360, 100, 100, 100);
Switches color mode to HSB (Hue, Saturation, Brightness) with ranges 0–360, 0–100, 0–100, 0–100, making it easy to create the green-to-red weather color ramp
textFont('monospace');
Sets text to monospace font, giving the radar a technical, broadcast TV appearance
textSize(13);
Sets label text size to 13 pixels so city names and tornado labels are readable
generateWeather();
Calls the weather generation function once on startup to populate the initial echoes and tornadoes arrays
noLoop();
Disables the default 60-FPS draw loop so the sketch only redraws when we explicitly call redraw()
autoRefreshTimer = setInterval(() => {
Creates a JavaScript timer that runs a function every autoRefreshMs milliseconds (3000 ms = 3 seconds by default)

draw()

draw() is the rendering pipeline. It runs only when redraw() is called (due to noLoop() in setup). The function calls specialized drawing routines in order: background, map, echoes, tornados, then HUD. This modular approach makes it easy to modify individual visual layers.

function draw() {
  // Dark bluish background like TV radar
  background(210, 40, 5);

  drawBaseMap();
  drawEchoes();
  drawTornados();
  drawHUD(); // now empty (no HUD text)
}
Line-by-line explanation (5 lines)

🔧 Subcomponents:

visual Radar background color background(210, 40, 5);

Sets the base canvas color to dark bluish (HSB: hue 210°, low saturation, very low brightness) mimicking a TV radar screen

background(210, 40, 5);
Fills the entire canvas with a dark blue color (HSB: 210 hue, 40% saturation, 5% brightness) that looks like a typical weather radar display
drawBaseMap();
Calls the function that renders grid lines, the map border, and the Providence, KY location marker
drawEchoes();
Calls the function that draws all radar echo rectangles with color-mapped reflectivity values and magenta hail cores
drawTornados();
Calls the function that renders tornado warning rings, rotating funnels, and TORNADO labels
drawHUD(); // now empty (no HUD text)
Calls the HUD function (which does nothing in this version—left as a placeholder for future overlays)

generateWeather()

generateWeather() is the heart of the sketch. It creates a procedural weather field by calculating intensity values on a grid, rotating coordinates to align with a front line, and combining multiple mathematical components (squall core, stratiform region, noise). This field-based approach is common in procedural generation, noise art, and scientific visualization.

🔬 These lines rotate the map coordinates so we can measure distance from the storm front. What happens if you swap the signs, changing them to const u = nx * cosF - ny * sinF and const v = nx * sinF + ny * cosF? The band will appear rotated differently on the next regeneration.

      // Rotate into coordinates along (u) and across (v) the front
      const u = nx * cosF + ny * sinF;      // along line
      const v = -nx * sinF + ny * cosF;     // perpendicular to line

🔬 This block creates the stratiform rain shield on one side of the squall line. What happens if you change v < 0 to v > 0? The light rain region will appear on the opposite side of the front.

      let stratField = 0;
      if (v < 0) { // choose one side as the cool sector
        const d = Math.abs(v) / (bandWidth * 2.5);
        if (d < 1) {
          stratField = (1 - d) * 0.55; // lighter but widespread echoes
        }
      }
function generateWeather() {
  echoes = [];
  tornadoes = [];

  // Choose grid resolution so each radar pixel is ~10px
  const targetCellSize = 10;
  gridCols = max(80, floor(width / targetCellSize));
  gridRows = max(50, floor(height / targetCellSize));

  cellW = width / gridCols;
  cellH = height / gridRows;

  // Line of storms oriented SW → NE (roughly -45° in math coords)
  const frontAngle = -PI / 4; // radians, math angle (0=+x, CCW)
  const cosF = cos(frontAngle);
  const sinF = sin(frontAngle);

  const bandWidth = 0.18; // core half-width in normalized coords

  for (let gy = 0; gy < gridRows; gy++) {
    for (let gx = 0; gx < gridCols; gx++) {
      // Normalized map coords (nx, ny) in approx [-1.2..1.2] × [-0.9..0.9]
      const nx = map(gx + 0.5, 0, gridCols, -1.2, 1.2);
      const ny = map(gy + 0.5, 0, gridRows, -0.9, 0.9);

      // Rotate into coordinates along (u) and across (v) the front
      const u = nx * cosF + ny * sinF;      // along line
      const v = -nx * sinF + ny * cosF;     // perpendicular to line

      const bandDist = Math.abs(v);

      // Main squall line core: strongest near v = 0, fading with distance
      const bandFactor = Math.exp(-Math.pow(bandDist / bandWidth, 2)); // 0..1

      // Along-line variation: cells / segments along the band
      const stripe = Math.pow(Math.sin(u * 3.0) * 0.5 + 0.5, 2); // 0..1

      let mainField = bandFactor * stripe;

      // Broad stratiform region on one (cool) side of the front
      let stratField = 0;
      if (v < 0) { // choose one side as the cool sector
        const d = Math.abs(v) / (bandWidth * 2.5);
        if (d < 1) {
          stratField = (1 - d) * 0.55; // lighter but widespread echoes
        }
      }

      // Combine fields
      let field = mainField * 1.4 + stratField;

      // Fade near the outer edges of the map
      const edgeX = smoothstep(0.95, 1.2, Math.abs(nx));
      const edgeY = smoothstep(0.95, 1.2, Math.abs(ny));
      const edgeMask = (1 - edgeX) * (1 - edgeY);
      field *= edgeMask;

      // Add small random texture
      field += random(-0.05, 0.12);

      let intensity = constrain(field, 0, 1);

      // Skip very weak returns (no echo)
      if (intensity < 0.10) continue;

      // Map normalized coords to screen pixels
      const sx = map(nx, -1.2, 1.2, 0, width);
      const sy = map(ny, 0.9, -0.9, 0, height); // ny positive = north (up)

      echoes.push({ x: sx, y: sy, intensity });
    }
  }

  // Extra light background drizzle / speckles
  const drizzleCount = floor(gridCols * gridRows * 0.08);
  for (let i = 0; i < drizzleCount; i++) {
    const sx = random(width);
    const sy = random(height);
    const intensity = random(0.06, 0.18);
    echoes.push({ x: sx, y: sy, intensity });
  }

  // Pick tornado locations from the strongest echoes
  generateTornadoesFromEchoes();
}
Line-by-line explanation (16 lines)

🔧 Subcomponents:

initialization Grid resolution calculation gridCols = max(80, floor(width / targetCellSize)); gridRows = max(50, floor(height / targetCellSize));

Calculates how many grid cells fit across the canvas, ensuring at least 80×50 cells for smooth radar appearance

calculation Front angle and rotation matrix const frontAngle = -PI / 4; // radians, math angle (0=+x, CCW) const cosF = cos(frontAngle); const sinF = sin(frontAngle);

Precomputes the cosine and sine of the front angle so the rotation calculation inside the loop is faster

for-loop Main weather field generation for (let gy = 0; gy < gridRows; gy++) { for (let gx = 0; gx < gridCols; gx++) {

Iterates over every grid cell to calculate weather intensity at that location

calculation Squall line core calculation const bandFactor = Math.exp(-Math.pow(bandDist / bandWidth, 2)); // 0..1

Uses a Gaussian function to create the characteristic shape of a rain band—strongest at center (v≈0), fading outward

conditional Stratiform rain region if (v < 0) { // choose one side as the cool sector const d = Math.abs(v) / (bandWidth * 2.5); if (d < 1) { stratField = (1 - d) * 0.55; // lighter but widespread echoes } }

Adds a broader, lighter rain shield on one side of the main squall line, mimicking real weather structure

calculation Edge fade mask const edgeX = smoothstep(0.95, 1.2, Math.abs(nx)); const edgeY = smoothstep(0.95, 1.2, Math.abs(ny)); const edgeMask = (1 - edgeX) * (1 - edgeY); field *= edgeMask;

Uses smoothstep to gradually fade out echoes near the map edges, avoiding hard boundaries

for-loop Background drizzle generation for (let i = 0; i < drizzleCount; i++) { const sx = random(width); const sy = random(height); const intensity = random(0.06, 0.18); echoes.push({ x: sx, y: sy, intensity }); }

Scatters light rain returns across the entire map to add visual texture and realism

echoes = [];
Clears the echoes array so we start fresh with a new weather field
tornadoes = [];
Clears the tornadoes array to remove old tornado markers before generating new ones
const targetCellSize = 10;
Sets a target pixel size for each grid cell—smaller values = more detailed radar, larger = blockier but faster
gridCols = max(80, floor(width / targetCellSize));
Calculates the number of grid columns, ensuring at least 80 columns so the radar is reasonably detailed
const nx = map(gx + 0.5, 0, gridCols, -1.2, 1.2);
Converts the grid column index into a normalized coordinate ranging from -1.2 to 1.2, representing the map's geographic extent
const ny = map(gy + 0.5, 0, gridRows, -0.9, 0.9);
Converts the grid row index into a normalized vertical coordinate from -0.9 to 0.9
const u = nx * cosF + ny * sinF; // along line
Rotates the normalized coordinates to align with the storm front—u measures distance along the front
const v = -nx * sinF + ny * cosF; // perpendicular to line
The perpendicular component—v measures distance across the front; v≈0 is the strongest rain band core
const bandFactor = Math.exp(-Math.pow(bandDist / bandWidth, 2)); // 0..1
Gaussian function: returns 1 near the front (v≈0) and decays exponentially with distance, creating a realistic rain band shape
const stripe = Math.pow(Math.sin(u * 3.0) * 0.5 + 0.5, 2); // 0..1
Uses sine waves along the front to create striations and texture variation—makes the band look segmented like real storms
let field = mainField * 1.4 + stratField;
Combines the strong squall core (multiplied by 1.4 for emphasis) with the lighter stratiform region
field *= edgeMask;
Multiplies the field by the edge mask, gradually fading out all echoes near the map boundary
field += random(-0.05, 0.12);
Adds random noise to break up the smooth field pattern and create a more realistic, grainy radar appearance
if (intensity < 0.10) continue;
Skips storing echoes that are very weak (below 10% intensity) to reduce clutter and improve performance
const sx = map(nx, -1.2, 1.2, 0, width);
Converts the normalized x coordinate back to screen pixel coordinates
echoes.push({ x: sx, y: sy, intensity });
Stores the calculated echo (position and intensity) as an object in the echoes array for later drawing

drawBaseMap()

drawBaseMap() renders the static map elements: grid lines for geographic reference, a border, and a location marker for Providence, KY. The grid mimics real weather radar displays, and the transparency of the overlay darkens the echoes so they stand out. By calling this before drawEchoes(), the echoes appear on top of the base map.

🔬 This draws two circles at the Providence marker—a filled white dot and a transparent ring. What happens if you change the fill color from 0, 0, 100 (white) to 0, 100, 60 (bright red)? The marker will appear red instead of white.

  const prov = lonLatToScreen(-87.76, 37.38);
  noStroke();
  fill(0, 0, 100, 100);
  ellipse(prov.x, prov.y, 6, 6);

  stroke(0, 0, 100, 70);
  noFill();
  ellipse(prov.x, prov.y, 18, 18);
function drawBaseMap() {
  rectMode(CORNER);

  // Subtle overlay to separate map area
  noStroke();
  fill(210, 40, 12, 80);
  rect(0, 0, width, height);

  // Lat/long-style grid lines
  stroke(210, 20, 40, 35);
  strokeWeight(1);

  const vLines = 7;
  for (let i = 1; i < vLines; i++) {
    const x = (width / vLines) * i;
    line(x, 0, x, height);
  }

  const hLines = 5;
  for (let i = 1; i < hLines; i++) {
    const y = (height / hLines) * i;
    line(0, y, width, y);
  }

  // Map border
  stroke(120, 30, 70, 80);
  noFill();
  rect(2, 2, width - 4, height - 4);

  // Providence, KY marker
  const prov = lonLatToScreen(-87.76, 37.38);
  noStroke();
  fill(0, 0, 100, 100);
  ellipse(prov.x, prov.y, 6, 6);

  stroke(0, 0, 100, 70);
  noFill();
  ellipse(prov.x, prov.y, 18, 18);

  // City label
  noStroke();
  fill(0, 0, 100, 100);
  textAlign(LEFT, BOTTOM);
  text('YOU', prov.x + 10, prov.y - 4);
}
Line-by-line explanation (11 lines)

🔧 Subcomponents:

visual Semi-transparent overlay fill(210, 40, 12, 80); rect(0, 0, width, height);

Draws a dark blueish-tinted rectangle over the entire canvas to darken echoes and create a radar screen atmosphere

for-loop Vertical grid lines for (let i = 1; i < vLines; i++) { const x = (width / vLines) * i; line(x, 0, x, height); }

Draws vertical lines to divide the map into longitude columns, imitating geographic grid lines

for-loop Horizontal grid lines for (let i = 1; i < hLines; i++) { const y = (height / hLines) * i; line(0, y, width, y); }

Draws horizontal lines to divide the map into latitude rows

visual City location marker const prov = lonLatToScreen(-87.76, 37.38); noStroke(); fill(0, 0, 100, 100); ellipse(prov.x, prov.y, 6, 6);

Converts Providence, KY coordinates to screen position and draws a white dot with a ring to mark the location

rectMode(CORNER);
Sets rectangle drawing mode so rect() interprets the first two arguments as the top-left corner (not the center)
fill(210, 40, 12, 80);
Sets fill color to dark blue with 80% alpha transparency, creating a semi-transparent overlay
rect(0, 0, width, height);
Draws a rectangle covering the entire canvas, darkening the background and creating the radar screen appearance
stroke(210, 20, 40, 35);
Sets the grid line color to a dim blue with 35% alpha, making them subtle and not distracting
const vLines = 7;
Decides to draw 7 vertical grid lines dividing the map into longitude sections
const x = (width / vLines) * i;
Calculates the x position for each vertical line by dividing the width evenly
line(x, 0, x, height);
Draws a vertical line from top to bottom at position x
const prov = lonLatToScreen(-87.76, 37.38);
Converts the longitude/latitude of Providence, KY into screen pixel coordinates using the lonLatToScreen() helper
ellipse(prov.x, prov.y, 6, 6);
Draws a small white circle (6 pixels diameter) at the Providence location
ellipse(prov.x, prov.y, 18, 18);
Draws a larger, transparent white ring (18 pixels diameter) around the location marker
text('YOU', prov.x + 10, prov.y - 4);
Labels the marker with the text 'YOU' positioned slightly to the right and above the marker dot

drawEchoes()

drawEchoes() is where the visual impact happens. It loops through all weather echoes and colors each one according to an NWS-style reflectivity ramp: green for weak rain, yellow for moderate, orange for strong, and red for severe. The saturation, brightness, and alpha also increase with intensity, creating visual depth. Magenta hail cores on the strongest echoes add a detail that real meteorologists use to identify dangerous rotation zones.

🔬 This is the color ramp that makes weak rain green and strong rain red—the heart of radar visualization. What happens if you reverse the numbers, changing 140→120 to 120→140 in every map() call? The entire color progression will flip, and now strong storms will be green instead of red. Try it!

    let hue;
    if (i < 0.25) {
      hue = map(i, 0, 0.25, 140, 120);   // light → medium green
    } else if (i < 0.5) {
      hue = map(i, 0.25, 0.5, 120, 90);  // green → yellow-green
    } else if (i < 0.75) {
      hue = map(i, 0.5, 0.75, 90, 60);   // yellow-green → yellow/orange
    } else {
      hue = map(i, 0.75, 1, 60, 0);      // orange → red
    }
function drawEchoes() {
  rectMode(CENTER);
  noStroke();

  const w = cellW * 1.2;
  const h = cellH * 1.2;

  for (const e of echoes) {
    const i = constrain(e.intensity, 0, 1);

    // NWS-ish reflectivity color ramp: green → yellow → red
    let hue;
    if (i < 0.25) {
      hue = map(i, 0, 0.25, 140, 120);   // light → medium green
    } else if (i < 0.5) {
      hue = map(i, 0.25, 0.5, 120, 90);  // green → yellow-green
    } else if (i < 0.75) {
      hue = map(i, 0.5, 0.75, 90, 60);   // yellow-green → yellow/orange
    } else {
      hue = map(i, 0.75, 1, 60, 0);      // orange → red
    }

    const sat = map(i, 0, 1, 60, 100);
    const bri = map(i, 0, 1, 70, 100);
    const alpha = map(i, 0, 1, 75, 100);

    fill(hue, sat, bri, alpha);
    rect(e.x, e.y, w, h);

    // Extra: hail cores (magenta spots) on very strong reflectivity
    if (i > 0.9) {
      fill(300, 80, 100, 90); // magenta in HSB
      ellipse(e.x, e.y, w * 0.6, h * 0.6);
    }
  }
}
Line-by-line explanation (19 lines)

🔧 Subcomponents:

conditional NWS-style reflectivity color ramp let hue; if (i < 0.25) { hue = map(i, 0, 0.25, 140, 120); // light → medium green } else if (i < 0.5) { hue = map(i, 0.25, 0.5, 120, 90); // green → yellow-green } else if (i < 0.75) { hue = map(i, 0.5, 0.75, 90, 60); // yellow-green → yellow/orange } else { hue = map(i, 0.75, 1, 60, 0); // orange → red }

Maps the echo intensity to a hue value following the NWS standard: weak returns are green, strong returns are red

conditional Hail core indicator if (i > 0.9) { fill(300, 80, 100, 90); // magenta in HSB ellipse(e.x, e.y, w * 0.6, h * 0.6); }

Draws magenta spots on the strongest echoes (intensity > 0.9) to indicate hail cores—a detail commonly seen on real radar

for-loop Echo rendering loop for (const e of echoes) {

Iterates through every echo object in the echoes array to color and draw each one

rectMode(CENTER);
Sets rectangle drawing mode so rect() treats the first two arguments as the center point, not the corner
const w = cellW * 1.2;
Sets the echo rectangle width to 120% of the grid cell size, making echoes slightly overlap for a cleaner appearance
const i = constrain(e.intensity, 0, 1);
Ensures the intensity value is clamped between 0 and 1, protecting against any out-of-range values
if (i < 0.25) {
Checks if the echo is very weak (less than 25% intensity) and maps it to a light-to-medium green hue
hue = map(i, 0, 0.25, 140, 120); // light → medium green
Maps intensity 0–0.25 to hue 140–120 degrees (green), creating a smooth color transition for weak returns
} else if (i < 0.5) {
Handles weak-to-moderate echoes (25–50% intensity)
hue = map(i, 0.25, 0.5, 120, 90); // green → yellow-green
Maps intensity 0.25–0.5 to hue 120–90 (yellow-green), continuing the color ramp
} else if (i < 0.75) {
Handles moderate-to-strong echoes (50–75% intensity)
hue = map(i, 0.5, 0.75, 90, 60); // yellow-green → yellow/orange
Maps intensity 0.5–0.75 to hue 90–60 (yellow to orange), approaching danger levels
} else {
Handles the strongest echoes (above 75% intensity)
hue = map(i, 0.75, 1, 60, 0); // orange → red
Maps intensity 0.75–1.0 to hue 60–0 (orange to bright red), indicating severe weather
const sat = map(i, 0, 1, 60, 100);
Increases saturation with intensity—weak echoes have muted colors, strong ones are vivid and saturated
const bri = map(i, 0, 1, 70, 100);
Increases brightness with intensity—stronger returns appear brighter, creating better visual hierarchy
const alpha = map(i, 0, 1, 75, 100);
Increases transparency with intensity—weak echoes are slightly transparent, strong ones are opaque
fill(hue, sat, bri, alpha);
Sets the fill color using the calculated HSB values before drawing each echo rectangle
rect(e.x, e.y, w, h);
Draws the echo as a rectangle centered at (e.x, e.y) with calculated dimensions and color
if (i > 0.9) {
Checks if this echo is extremely strong (above 90% intensity), marking it as a potential hail core
fill(300, 80, 100, 90); // magenta in HSB
Sets fill to magenta (HSB: 300° hue, high saturation and brightness, 90% opacity)
ellipse(e.x, e.y, w * 0.6, h * 0.6);
Draws a small magenta circle (60% of echo size) at the same position, highlighting hail cores

drawTornados()

drawTornados() renders tornado warning symbols using push/pop and transformations to create a spinning effect. The triangle rotates based on frameCount, which increments every time redraw() is called. Although draw() doesn't run in a loop (due to noLoop()), when a new weather system is generated, redraw() is called multiple times rapidly, creating the spinning illusion. This is a good example of using frameCount in non-looping sketches.

🔬 This block draws a spinning red triangle. What happens if you change rotate(frameCount * 0.15) to rotate(frameCount * -0.15)? The triangle will spin in the opposite direction—counterclockwise instead of clockwise.

    push();
    translate(t.x, t.y);
    // Slight rotation that changes with frameCount
    rotate(frameCount * 0.15);
    noStroke();
    fill(0, 100, 100, 90); // red
    const size = r * 0.9;
    triangle(
      -size * 0.4, size * 0.5,
      0,          -size * 0.7,
      size * 0.4, size * 0.5
    );
    pop();
function drawTornados() {
  for (const t of tornadoes) {
    const r = map(t.strength, 0.8, 1, 16, 28, true);

    // Red warning ring
    noFill();
    stroke(0, 100, 100, 90); // bright red
    strokeWeight(2);
    ellipse(t.x, t.y, r * 2, r * 2);

    // Tornado "funnel" triangle
    push();
    translate(t.x, t.y);
    // Slight rotation that changes with frameCount
    rotate(frameCount * 0.15);
    noStroke();
    fill(0, 100, 100, 90); // red
    const size = r * 0.9;
    triangle(
      -size * 0.4, size * 0.5,
      0,          -size * 0.7,
      size * 0.4, size * 0.5
    );
    pop();

    // Label text
    noStroke();
    fill(0, 0, 100, 100);
    textAlign(LEFT, CENTER);
    text('TORNADO', t.x + r + 6, t.y);
  }
}
Line-by-line explanation (16 lines)

🔧 Subcomponents:

for-loop Tornado iteration for (const t of tornadoes) {

Loops through every tornado object in the tornadoes array to draw each one with a ring, rotating symbol, and label

visual Red warning circle ellipse(t.x, t.y, r * 2, r * 2);

Draws a red circle around each tornado location as a visual warning symbol

visual Rotating tornado symbol push(); translate(t.x, t.y); rotate(frameCount * 0.15); // ... triangle drawing ... pop();

Uses push/pop and translate/rotate to draw a spinning red triangle that rotates every frame, indicating tornado motion

for (const t of tornadoes) {
Loops through every tornado object in the tornadoes array
const r = map(t.strength, 0.8, 1, 16, 28, true);
Maps the tornado's strength (0.8–1.0 range) to a radius (16–28 pixels), with the 'true' flag allowing values outside the input range if needed
noFill();
Disables fill so the next circle will be drawn as an outline only
stroke(0, 100, 100, 90); // bright red
Sets stroke color to bright red (HSB: 0° hue, 100% saturation and brightness, 90% opacity)
strokeWeight(2);
Sets the line thickness to 2 pixels for the warning ring
ellipse(t.x, t.y, r * 2, r * 2);
Draws a red circle with diameter r*2 centered at the tornado location
push();
Saves the current transformation state (matrix, fill, stroke, etc.) so we can rotate without affecting the rest of the code
translate(t.x, t.y);
Moves the origin to the tornado's center point, so subsequent drawing happens relative to this location
rotate(frameCount * 0.15);
Rotates the coordinate system by an angle that increases every frame—frameCount goes up by 1 each frame, so the rotation continuously increases
const size = r * 0.9;
Calculates the triangle size as 90% of the circle radius
triangle(
Begins drawing a triangle with three vertices positioned relative to the rotated origin
-size * 0.4, size * 0.5,
First vertex (bottom-left): 40% of size to the left, 50% down
0, -size * 0.7,
Second vertex (top): at the center horizontally, 70% up
size * 0.4, size * 0.5
Third vertex (bottom-right): 40% of size to the right, 50% down
pop();
Restores the saved transformation state, so subsequent drawing is back to normal coordinates
text('TORNADO', t.x + r + 6, t.y);
Writes the word 'TORNADO' in white text to the right of the warning ring, roughly centered vertically at the tornado location

drawHUD()

drawHUD() is a placeholder function left in the code for future extension. You could add text overlays here such as a timestamp, radar mode ('Clear Air', 'Precipitation'), wind barb symbols, or a reflectivity legend—common elements on real NWS radar displays.

function drawHUD() {
  // Intentionally left blank — no extra HUD text or bars
}
Line-by-line explanation (1 lines)
// Intentionally left blank — no extra HUD text or bars
This function is intentionally empty as a placeholder for future UI elements like timestamps, radar type labels, or legend information

lonLatToScreen(lon, lat)

lonLatToScreen() is a utility function that converts geographic coordinates (longitude/latitude) to screen pixel positions. It uses map() to scale the geographic extent (defined by LON_MIN, LON_MAX, LAT_MIN, LAT_MAX constants) to the canvas. Note the reversed latitude order: latitude increases northward in real geography, but y-coordinates increase downward on screen, so LAT_MAX (north) maps to y=0 (top).

function lonLatToScreen(lon, lat) {
  const x = map(lon, LON_MIN, LON_MAX, 0, width);
  const y = map(lat, LAT_MAX, LAT_MIN, 0, height); // lat up = smaller y
  return { x, y };
}
Line-by-line explanation (3 lines)
const x = map(lon, LON_MIN, LON_MAX, 0, width);
Uses map() to convert a longitude value (between LON_MIN and LON_MAX) to a horizontal screen pixel (0 to width)
const y = map(lat, LAT_MAX, LAT_MIN, 0, height);
Converts latitude to a vertical pixel, with LAT_MAX (north, larger numbers) mapping to y=0 (top of screen) and LAT_MIN (south) to y=height (bottom)—note the reversed order to flip the y-axis
return { x, y };
Returns an object containing the screen coordinates so the caller can use them to position elements like the city marker

generateTornadoesFromEchoes()

generateTornadoesFromEchoes() is responsible for placing tornado markers. It filters the strongest echoes, adds a rarity check so tornadoes appear infrequently, and uses a while loop with a separation constraint to avoid overlapping warnings. The safety counter prevents infinite loops. This function demonstrates common game/simulation patterns: filtering candidates, applying rarity via random numbers, and enforcing spacing constraints.

🔬 This line makes tornadoes rare—it has a 70% chance of creating no tornado on a radar refresh. What happens if you change 0.7 to 0.3? Now tornadoes will appear ~70% of the time instead of ~30%, making them much more common.

  // Make tornadoes rare: only some scans have any tornado at all
  if (random() < 0.7) return; // ~70% of frames: no tornadoes
function generateTornadoesFromEchoes() {
  tornadoes = [];

  // Candidate echoes: VERY strong reflectivity
  const candidates = [];
  for (const e of echoes) {
    if (e.intensity > 0.9) { // higher threshold → fewer candidates
      candidates.push(e);
    }
  }

  if (candidates.length === 0) return;

  // Make tornadoes rare: only some scans have any tornado at all
  if (random() < 0.7) return; // ~70% of frames: no tornadoes

  const maxTornadoes = 1; // at most one tornado per frame
  const minSeparation = min(width, height) * 0.12;
  let safety = 0;

  while (tornadoes.length < maxTornadoes && safety < 200 && candidates.length > 0) {
    safety++;
    const pick = random(candidates); // p5.random(array) → random element

    let ok = true;
    for (const t of tornadoes) {
      if (dist(pick.x, pick.y, t.x, t.y) < minSeparation) {
        ok = false;
        break;
      }
    }
    if (ok) {
      tornadoes.push({
        x: pick.x,
        y: pick.y,
        strength: pick.intensity
      });
    }
  }
}
Line-by-line explanation (20 lines)

🔧 Subcomponents:

for-loop Strong echo candidate selection for (const e of echoes) { if (e.intensity > 0.9) { // higher threshold → fewer candidates candidates.push(e); } }

Filters echoes to find only the very strongest ones (intensity > 0.9) that could be tornado cores

conditional Tornado rarity filter if (random() < 0.7) return; // ~70% of frames: no tornadoes

Randomly skips tornado generation ~70% of the time, making tornadoes rare and realistic

while-loop Tornado placement with separation check while (tornadoes.length < maxTornadoes && safety < 200 && candidates.length > 0) { safety++; const pick = random(candidates); let ok = true; for (const t of tornadoes) { if (dist(pick.x, pick.y, t.x, t.y) < minSeparation) { ok = false; break; } } if (ok) { tornadoes.push({ ... }); } }

Attempts to place tornadoes at strong echo locations while ensuring they are separated by a minimum distance

tornadoes = [];
Clears the tornadoes array to start fresh
const candidates = [];
Creates an empty array to store the strongest echoes that could become tornado locations
for (const e of echoes) {
Loops through every echo in the echoes array
if (e.intensity > 0.9) { // higher threshold → fewer candidates
Only keeps echoes with intensity above 90%, filtering out weak and moderate returns
candidates.push(e);
Adds the very strong echo to the candidates array
if (candidates.length === 0) return;
If no strong echoes exist, exit early—no tornado possible without a strong radar core
if (random() < 0.7) return; // ~70% of frames: no tornadoes
Generates a random number 0–1; if it's less than 0.7, the function exits early without creating a tornado. This means ~70% chance of no tornado, ~30% chance of trying to place one
const maxTornadoes = 1; // at most one tornado per frame
Sets a limit of 1 tornado per weather generation event, avoiding cluttered maps with too many warnings
const minSeparation = min(width, height) * 0.12;
Calculates a minimum distance that tornadoes must be apart—12% of the smaller canvas dimension
let safety = 0;
Initializes a safety counter to prevent infinite loops if placement becomes impossible
while (tornadoes.length < maxTornadoes && safety < 200 && candidates.length > 0) {
Loops up to 200 times, trying to place 1 tornado, as long as candidates remain available
safety++;
Increments the safety counter to eventually break out of the loop
const pick = random(candidates); // p5.random(array) → random element
Randomly selects one candidate echo from the candidates array
let ok = true;
Assumes the picked location is valid until proven otherwise by the separation check
for (const t of tornadoes) {
Loops through all already-placed tornadoes to check separation distance
if (dist(pick.x, pick.y, t.x, t.y) < minSeparation) {
Uses dist() to measure the distance between the candidate and an existing tornado; if too close, mark as invalid
ok = false;
Sets ok to false, signaling that this candidate location is too close to an existing tornado
break;
Exits the separation-check loop early since we already found a conflict
if (ok) {
If the location passed all separation checks (ok is still true), place the tornado
tornadoes.push({ x: pick.x, y: pick.y, strength: pick.intensity });
Adds a new tornado object to the tornadoes array with its position and strength copied from the selected candidate echo

smoothstep(edge0, edge1, x)

smoothstep() is a classic interpolation function used in computer graphics and procedural generation to create smooth transitions between two values. It returns 0 when x ≤ edge0, returns 1 when x ≥ edge1, and in between it follows a cubic curve that accelerates then decelerates smoothly. This avoids the harsh line at map edges in generateWeather() by gradually fading echoes near the map boundary.

function smoothstep(edge0, edge1, x) {
  const t = constrain((x - edge0) / (edge1 - edge0), 0, 1);
  return t * t * (3 - 2 * t);
}
Line-by-line explanation (2 lines)
const t = constrain((x - edge0) / (edge1 - edge0), 0, 1);
Normalizes the input x to a value between 0 and 1: (x - edge0) / (edge1 - edge0) calculates how far x is between the two edges, and constrain() clamps the result to 0–1
return t * t * (3 - 2 * t);
Applies a smooth cubic interpolation formula: t² × (3 - 2t). When t=0 it returns 0, when t=1 it returns 1, and in between it creates a smooth S-curve with zero derivatives at the edges

mousePressed()

mousePressed() is called automatically by p5.js whenever the user clicks the mouse. In this sketch, it regenerates the weather instantly, allowing the viewer to explore different storm configurations by clicking. This is a simple but effective interaction pattern for procedural systems.

function mousePressed() {
  generateWeather();
  redraw(); // re-render once
}
Line-by-line explanation (2 lines)
generateWeather();
Calls generateWeather() to create a completely new random weather pattern
redraw(); // re-render once
Explicitly calls redraw() to render the new weather on screen, since noLoop() prevents automatic redraws

touchStarted()

touchStarted() is similar to mousePressed() but fires on mobile/touch devices instead of mouse clicks. Returning false prevents default browser behavior like scrolling, ensuring the touch interaction is consumed entirely by the sketch.

function touchStarted() {
  generateWeather();
  redraw(); // re-render once
  return false; // prevent scrolling on mobile
}
Line-by-line explanation (3 lines)
generateWeather();
Calls generateWeather() to create a new weather pattern when the user touches the screen
redraw(); // re-render once
Renders the new weather immediately
return false; // prevent scrolling on mobile
Returns false to prevent the browser from treating the touch as a page scroll, keeping the sketch interactive on mobile devices

windowResized()

windowResized() is called automatically by p5.js whenever the browser window is resized. It ensures the canvas and all weather calculations adapt gracefully to the new size, maintaining a responsive experience on different screen dimensions.

function windowResized() {
  resizeCanvas(windowWidth, windowHeight);
  generateWeather();
  redraw();
}
Line-by-line explanation (3 lines)
resizeCanvas(windowWidth, windowHeight);
Automatically resizes the p5.js canvas to match the new browser window dimensions whenever the user resizes their window
generateWeather();
Regenerates the weather pattern to fit the new canvas size—the grid resolution and field calculations adapt to the new dimensions
redraw();
Renders the resized map with the new weather pattern on screen

📦 Key Variables

echoes array

Stores all radar echo objects; each object has x (screen pixel), y (screen pixel), and intensity (0–1) properties representing detected weather returns

let echoes = [];
tornadoes array

Stores tornado warning objects; each has x, y, and strength properties indicating tornado location and intensity for visualization

let tornadoes = [];
gridCols number

Number of grid columns used to divide the canvas for weather field generation—recalculated on each regeneration based on window width

let gridCols;
gridRows number

Number of grid rows used to divide the canvas—recalculated on each regeneration based on window height

let gridRows;
cellW number

Width of each grid cell in pixels, calculated as width / gridCols—controls the size of individual radar echo rectangles

let cellW;
cellH number

Height of each grid cell in pixels, calculated as height / gridRows

let cellH;
autoRefreshMs number

Milliseconds between automatic weather regenerations—default 3000 ms (3 seconds); controls how often the radar updates without user input

let autoRefreshMs = 3000;
autoRefreshTimer object

Stores the JavaScript interval ID created by setInterval(), allowing the auto-refresh timer to be controlled

let autoRefreshTimer = null;
LON_MIN number

Minimum longitude of the map region (westernmost), used by lonLatToScreen() to scale geographic coordinates

const LON_MIN = -92.0;
LON_MAX number

Maximum longitude of the map region (easternmost)

const LON_MAX = -84.0;
LAT_MIN number

Minimum latitude of the map region (southernmost)

const LAT_MIN = 35.0;
LAT_MAX number

Maximum latitude of the map region (northernmost)

const LAT_MAX = 39.5;

🔧 Potential Improvements (5)

Here are some ways this code could be enhanced:

PERFORMANCE generateWeather()

Every grid cell calculates Math.exp, Math.pow, Math.sin, and Math.abs separately—expensive trig operations repeat across potentially thousands of cells

💡 Precompute lookup tables or use vectorized operations for the Gaussian and sine functions to reduce CPU load and improve responsiveness on low-end devices

BUG generateTornadoesFromEchoes()

The candidates array can be very large, and random(candidates) with a while loop may take many iterations if most candidate locations fail the separation check, wasting CPU cycles

💡 Sort candidates by strength descending and pick from the top few strongest echoes, or implement spatial hashing to check collisions more efficiently

FEATURE drawHUD()

The HUD function is intentionally empty—there are no labels, timestamp, or legend to explain the color ramp or warn about the radar delay

💡 Add drawHUD() content such as a reflectivity legend (green = light, yellow = moderate, red = severe), a 'LIVE' or 'DELAYED' indicator, and maybe a timestamp to complete the TV-style appearance

STYLE generateWeather()

Magic numbers like 0.18 (bandWidth), 3.0 (stripe frequency), 0.55 (stratiform intensity), and 0.08 (drizzle ratio) are hardcoded inline, making the weather pattern hard to tweak without reading the code carefully

💡 Extract these into named constants at the top of the file (e.g., const BAND_WIDTH = 0.18, const STRIPE_FREQ = 3.0) to make the parameters self-documenting and easy to experiment with

FEATURE setup() and draw()

The sketch uses noLoop() and redraw(), but redraw() is called synchronously in mousePressed/touchStarted—if generateWeather() takes >16ms, the frame rate will drop noticeably

💡 Defer weather generation to a requestAnimationFrame callback or async task to prevent blocking the main thread, or split generateWeather() into smaller chunks if performance is an issue on slower devices

🔄 Code Flow

Code flow showing setup, draw, generateweather, drawbasemap, drawechoes, drawtornados, drawhud, lontlattoscreen, generatetornadoesfromechoes, smoothstep, mousepressed, touchstarted, windowresized

💡 Click on function names in the diagram to jump to their code

graph TD start[Start] --> setup[setup] setup --> draw[draw loop] click setup href "#fn-setup" click draw href "#fn-draw" setup --> color-mode-setup[color-mode-setup] setup --> loop-control[loop-control] setup --> auto-refresh-timer[auto-refresh-timer] setup --> radar-background[radar-background] setup --> grid-setup[grid-setup] click color-mode-setup href "#sub-color-mode-setup" click loop-control href "#sub-loop-control" click auto-refresh-timer href "#sub-auto-refresh-timer" click radar-background href "#sub-radar-background" click grid-setup href "#sub-grid-setup" draw --> drawbasemap[drawBaseMap] draw --> drawechoes[drawEchoes] draw --> drawtornados[drawTornados] draw --> drawhud[drawHUD] click drawbasemap href "#fn-drawbasemap" click drawechoes href "#fn-drawechoes" click drawtornados href "#fn-drawtornados" click drawhud href "#fn-drawhud" drawbasemap --> overlay-background[overlay-background] drawbasemap --> vertical-gridlines[vertical-gridlines] drawbasemap --> horizontal-gridlines[horizontal-gridlines] drawbasemap --> providence-marker[providence-marker] click overlay-background href "#sub-overlay-background" click vertical-gridlines href "#sub-vertical-gridlines" click horizontal-gridlines href "#sub-horizontal-gridlines" click providence-marker href "#sub-providence-marker" drawechoes --> echo-loop[echo-loop] echo-loop --> color-ramp-calculation[color-ramp-calculation] echo-loop --> hail-core-marking[hail-core-marking] click echo-loop href "#sub-echo-loop" click color-ramp-calculation href "#sub-color-ramp-calculation" click hail-core-marking href "#sub-hail-core-marking" drawtornados --> tornado-loop[tornado-loop] tornado-loop --> warning-ring[warning-ring] tornado-loop --> rotating-funnel[rotating-funnel] click tornado-loop href "#sub-tornado-loop" click warning-ring href "#sub-warning-ring" click rotating-funnel href "#sub-rotating-funnel" mousepressed[mousePressed] --> generateweather[generateWeather] click mousepressed href "#fn-mousepressed" generateweather --> main-grid-loop[main-grid-loop] main-grid-loop --> front-rotation[front-rotation] main-grid-loop --> squall-core[squall-core] main-grid-loop --> stratiform-region[stratiform-region] main-grid-loop --> edge-fade[edge-fade] main-grid-loop --> drizzle-loop[drizzle-loop] click generateweather href "#fn-generateweather" click main-grid-loop href "#sub-main-grid-loop" click front-rotation href "#sub-front-rotation" click squall-core href "#sub-squall-core" click stratiform-region href "#sub-stratiform-region" click edge-fade href "#sub-edge-fade" click drizzle-loop href "#sub-drizzle-loop" generatetornadoesfromechoes[generateTornadoesFromEchoes] --> candidate-filter[candidate-filter] candidate-filter --> rarity-check[rarity-check] rarity-check --> placement-loop[placement-loop] click generatetornadoesfromechoes href "#fn-generatetornadoesfromechoes" click candidate-filter href "#sub-candidate-filter" click rarity-check href "#sub-rarity-check" click placement-loop href "#sub-placement-loop" windowresized[windowResized] --> draw click windowresized href "#fn-windowresized"

❓ Frequently Asked Questions

What visual elements does the p5 storm chasing project sketch display?

The sketch creates a TV-style radar map featuring a SW–NE band of rain, tornado and hail markers, and a city marker for Providence, KY.

How can users interact with the p5 storm chasing project sketch?

Users can tap or click on the canvas to regenerate the weather patterns and the sketch automatically refreshes every few seconds.

What coding techniques are illustrated in the p5 storm chasing project?

This project demonstrates creative coding techniques such as procedural generation of weather patterns and real-time canvas rendering in p5.js.

Preview

p5 storm chasing project (Remix) - p5.js creative coding sketch preview
Sketch Preview
Code flow diagram showing the structure of p5 storm chasing project (Remix) - Code flow showing setup, draw, generateweather, drawbasemap, drawechoes, drawtornados, drawhud, lontlattoscreen, generatetornadoesfromechoes, smoothstep, mousepressed, touchstarted, windowresized
Code Flow Diagram