
AI Kaleidoscope Generator - Symmetrical Pattern Art Draw mesmerizing symmetrical patterns with real (Remix)

This sketch creates an interactive kaleidoscope generator where you draw with your mouse and watch your strokes multiply into hypnotic symmetrical patterns. The symmetry, rotation speed, and colors all respond to real-time controls, letting you create mesmerizing glowing art instantly.

🧪 Try This!

Experiment with the code by making these changes:

  1. Make strokes thicker — Change strokeWeight() to a higher number to draw bold, dramatic kaleidoscope patterns that are instantly more visible.
  2. Add more color choices — Expand the symmetry options in the GUI dropdown so you can toggle between more axis counts like 4, 5, 10, and 16.
  3. Speed up the spin — Increase the default rotation speed so the kaleidoscope spins faster without touching the slider.
  4. Color the background — Change the black background to a dark blue or purple for a different atmosphere.
  5. Freeze the rotation — Remove the auto-spinning by zeroing out the frameCount multiplier—the pattern will only rotate with your mouse/device.
  6. Make lines connect smoothly — Switch from LINES mode (individual segments) to LINE_STRIP mode (one continuous path) for a flowing appearance.
Prefer the full editor? Open it there →

📖 About This Sketch

This sketch transforms simple mouse strokes into elaborate kaleidoscopic artwork by multiplying your drawing across multiple symmetry axes and reflecting it. The visual effect combines WEBGL mode for smooth rendering, 2D-to-3D coordinate transformation, push/pop matrix stacking for reflections, and HSB color mode for harmonic palette generation—all working together to create hypnotic, spinning patterns that respond to your touch.

The code is organized around four core ideas: capturing mouse points into an array, rotating and mirroring that array multiple times per frame using transformations, cycling through a generated color palette to animate the strokes, and providing live controls via dat.GUI to adjust symmetry, speed, and appearance. By studying it, you'll learn how transformation matrices (push/pop), modular drawing functions, and real-time parameter updates power interactive generative art.

⚙️ How It Works

  1. When the sketch loads, setup() creates a full-screen WEBGL canvas, switches to HSB color mode, initializes the dat.GUI control panel, and generates the first harmonious color palette.
  2. Every frame, draw() clears the background and applies global rotation based on settings; it then loops through each symmetry axis, rotating and drawing the user's strokes normally, then reflecting them horizontally (scale(1, -1)) before restoring the matrix state.
  3. When you click the mouse, mousePressed() clears the drawing array and starts fresh; when you drag, mouseDragged() adds your current position to the array.
  4. Every 500 points drawn, the generatePalette() function automatically picks a new random base hue and creates a triad of colors plus complementary and analogous hues for a harmonious palette.
  5. The drawStroke() function renders the points either as individual crystallized dots or as smooth lines, cycling through palette colors based on frameCount to animate the color flow.
  6. Optional symmetry lines are drawn as radial guides if enabled, and device rotation sensors (on mobile) subtly tilt the pattern in response to phone movement.

🎓 Concepts You'll Learn

WEBGL mode and 3D coordinate systemMatrix transformations (push, pop, rotate, scale)HSB color mode and palette generationReal-time mouse interaction and event handlersSymmetry and reflection geometryArray-based point storage and drawing

📝 Code Breakdown

setup()

setup() runs once when the sketch starts and is where you configure the canvas size, color space, initial variables, and interactive controls. WEBGL mode is key here—it centers the canvas origin at the middle rather than the top-left, which makes rotation and symmetry math much cleaner.

function setup() {
  // Create a canvas in WEBGL mode for better gradient and glow effects
  createCanvas(windowWidth, windowHeight, WEBGL);

  // Use HSB color mode for easier color harmony generation and cycling
  colorMode(HSB, 360, 100, 100, 100);

  // Set angle mode to RADIANS for rotate() function
  angleMode(RADIANS);

  // No fill for strokes
  noFill();

  // Initial stroke weight
  strokeWeight(2);

  // Generate an initial color palette
  generatePalette();

  // Initialize dat.GUI
  gui = new dat.GUI();
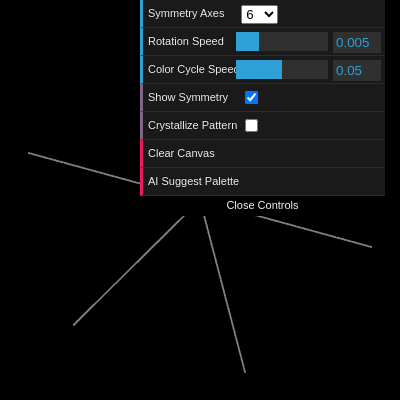
  gui.add(settings, 'symmetryCount', [6, 8, 12]).name('Symmetry Axes');
  gui.add(settings, 'rotationSpeed', 0, 0.02).name('Rotation Speed');
  gui.add(settings, 'colorCyclingSpeed', 0, 0.1).name('Color Cycle Speed');
  gui.add(settings, 'showSymmetryLines').name('Show Symmetry Lines');
  gui.add(settings, 'isCrystallized').name('Crystallize Pattern');
  gui.add(settings, 'clearCanvas').name('Clear Canvas');
  gui.add(settings, 'suggestPalette').name('AI Suggest Palette'); // Manual trigger for AI suggestion

  // Request device access for motion sensors (for mobile devices)
  if (typeof DeviceOrientationEvent !== 'undefined' && typeof DeviceOrientationEvent.requestPermission === 'function') {
    DeviceOrientationEvent.requestPermission()
      .then(permissionState => {
        if (permissionState === 'granted') {
          console.log('Device orientation permission granted.');
        } else {
          console.log('Device orientation permission denied.');
        }
      })
      .catch(console.error);
  }
}
Line-by-line explanation (7 lines)

🔧 Subcomponents:

function-call WEBGL Canvas Setup createCanvas(windowWidth, windowHeight, WEBGL);

Creates a full-screen 3D canvas using WEBGL mode, which enables smooth, hardware-accelerated rendering better than 2D mode

function-call HSB Color Mode Configuration colorMode(HSB, 360, 100, 100, 100);

Switches to HSB (Hue-Saturation-Brightness) mode, making it easier to generate harmonious color palettes and cycle colors

control-structure dat.GUI Control Panel Setup gui = new dat.GUI();

Creates an interactive control panel in the corner where users can adjust symmetry, speed, colors, and trigger functions

createCanvas(windowWidth, windowHeight, WEBGL);
Creates a full-screen WEBGL canvas (not 2D). WEBGL mode provides hardware acceleration and allows for better 3D transformations and coordinate centering at the middle of the canvas rather than the top-left corner.
colorMode(HSB, 360, 100, 100, 100);
Switches from default RGB to HSB color space (Hue 0-360, Saturation 0-100, Brightness 0-100, Alpha 0-100). This is perfect for generating harmonious color schemes and cycling colors smoothly.
angleMode(RADIANS);
Sets all rotation angles to use radians (0 to TWO_PI) instead of degrees (0 to 360), which is standard in mathematics and required for rotate() to work with TWO_PI.
noFill();
Disables fill color for all shapes drawn after this—only strokes (outlines) will be visible, which is what we want for this line-based kaleidoscope.
strokeWeight(2);
Sets the thickness of all strokes to 2 pixels. This can be changed to make lines thicker or thinner.
generatePalette();
Calls the color palette generator function immediately at startup to create the first set of harmonious colors from a random base hue.
gui = new dat.GUI();
Creates a new dat.GUI control panel object in the top-right corner that lets users interactively adjust parameters without editing code.

draw()

draw() is the heart of the sketch—it runs 60 times per second and combines three key ideas: (1) clearing the canvas, (2) applying a global rotation to spin the whole pattern, and (3) looping through symmetry axes, rotating and mirroring the user's strokes each time. Understanding push/pop and how rotate/scale/translate compose is essential to mastering generative symmetrical art.

🔬 These two lines control spinning. What if you multiply frameCount * settings.rotationSpeed by 2? The pattern will spin twice as fast. What if you add a third line, rotateY(frameCount * settings.rotationSpeed * 0.3), to add a slow sideways rotation?

  rotateZ(frameCount * settings.rotationSpeed + deviceRotationY * 0.005);
  rotateX(deviceRotationX * 0.005);
function draw() {
  // Always clear the background in WEBGL mode
  // The radial gradient function was attempting to use 2D canvas methods
  // which are not available in WEBGL's drawingContext.
  // For a minimal fix, we'll use a solid black background.
  background(0); // Clear the background with solid black

  // Translate to the center of the canvas in 3D space and move slightly back
  // This allows for better perspective and viewing of 2D shapes in WEBGL
  translate(0, 0, -min(width, height) / 4);

  // Apply global rotation based on settings and device sensors
  // Use deviceRotationX and deviceRotationY for subtle device-based rotation
  rotateZ(frameCount * settings.rotationSpeed + deviceRotationY * 0.005);
  rotateX(deviceRotationX * 0.005);

  // Calculate the angle for each symmetry slice
  let angle = TWO_PI / settings.symmetryCount;

  // Draw all symmetrical reflections
  for (let i = 0; i < settings.symmetryCount; i++) {
    push(); // Save the current transformation state

    // Rotate for each symmetry slice
    rotateZ(i * angle);

    // Draw the strokes
    drawStroke(drawingPoints, settings.isCrystallized);

    // Apply horizontal reflection (scale Y by -1)
    scale(1, -1);

    // Draw the reflected strokes
    drawStroke(drawingPoints, settings.isCrystallized);

    pop(); // Restore the previous transformation state
  }

  // Draw symmetry lines if enabled
  if (settings.showSymmetryLines) {
    drawSymmetryLines();
  }
}
Line-by-line explanation (13 lines)

🔧 Subcomponents:

for-loop Symmetry Multiplication Loop for (let i = 0; i < settings.symmetryCount; i++) {

Repeats the drawing code once for each symmetry axis, rotating the coordinate system and mirroring to create the kaleidoscopic effect

transformation Horizontal Reflection scale(1, -1);

Flips the Y-axis to create a mirror image of the strokes without changing X coordinates

conditional Optional Symmetry Guide Lines if (settings.showSymmetryLines) {

Conditionally draws radial lines to show where the mirrors are located

background(0);
Clears the canvas with HSB color (0, ?, ?) which is black (0% brightness). In HSB, the hue value doesn't matter when saturation and brightness are 0.
translate(0, 0, -min(width, height) / 4);
Moves the camera backward in 3D space (negative Z direction), which gives a slight perspective effect and prevents clipping at the edges of the WEBGL viewport.
rotateZ(frameCount * settings.rotationSpeed + deviceRotationY * 0.005);
Continuously rotates the entire pattern around the Z-axis (the camera's forward direction). frameCount increases every frame, so this creates smooth spinning. deviceRotationY adds subtle tilt from mobile phone sensors.
rotateX(deviceRotationX * 0.005);
Tilts the pattern forward and backward based on mobile device tilt. Desktop users will see no change unless they're using a device with motion sensors.
let angle = TWO_PI / settings.symmetryCount;
Divides a full rotation (TWO_PI radians = 360°) by the symmetry count. For 6 symmetries, this gives 60°; for 8, this gives 45°—each slice is one rotational wedge.
for (let i = 0; i < settings.symmetryCount; i++) {
Loops once for each symmetry axis. If symmetryCount is 6, this loop runs 6 times, each time drawing rotated and reflected copies of your strokes.
push();
Saves the current transformation matrix (all rotations, scales, and translations applied so far) so we can restore it after each iteration.
rotateZ(i * angle);
Rotates by i * angle (0°, then 60°, then 120°, etc. for a 6-fold pattern). This positions each symmetry wedge in a different direction.
drawStroke(drawingPoints, settings.isCrystallized);
Draws the stored points (your strokes) as lines or crystallized dots, cycling through the color palette. This draws them in their current rotated position.
scale(1, -1);
Flips the Y-axis (vertical mirror). The scale values (1, -1) mean 'keep X the same, flip Y.' This creates a mirror image without changing the rotation.
drawStroke(drawingPoints, settings.isCrystallized);
Draws the strokes again in their flipped state. Combined with the rotated position, this creates the kaleidoscopic reflection you see.
pop();
Restores the transformation matrix to what it was before push(), so the next loop iteration starts clean and the different copies don't stack rotations.
if (settings.showSymmetryLines) {
Conditionally draws faint radial lines to visualize the mirror axes. This is purely visual guidance and can be toggled on/off in the GUI.

drawStroke(points, crystallized)

drawStroke() is responsible for rendering the user's drawn points either as smooth lines or as crystallized dots. It demonstrates two key rendering techniques: POINTS mode for individual markers and LINES mode for connecting segments. The color cycling math is elegant—frameCount provides steady animation, the palette index wraps with modulo, and indexOf() gives each point a phase offset for flowing color waves.

function drawStroke(points, crystallized) {
  if (points.length === 0) return;

  // Drawing points as individual points is simpler in WEBGL
  if (crystallized || points.length < 2) {
    beginShape(POINTS);
    for (let point of points) {
      let col = palette[floor(frameCount * settings.colorCyclingSpeed + points.indexOf(point)) % palette.length];
      stroke(col);
      // drawingContext.shadow* properties are 2D canvas properties and do not work in WEBGL.
      // For proper glow in WEBGL, a post-processing shader is usually required.
      // Removing these for a cleaner WEBGL rendering.
      // drawingContext.shadowColor = color(hue(col), saturation(col), brightness(col), 50).toString();
      // drawingContext.shadowBlur = 10;
      vertex(point.x, point.y);
    }
    endShape();
  } else {
    // For smooth curves, draw simple lines between points for a smoother appearance.
    beginShape(LINES);
    for (let i = 0; i < points.length - 1; i++) {
      let p1 = points[i];
      let p2 = points[i+1];
      let col = palette[floor(frameCount * settings.colorCyclingSpeed + i) % palette.length];
      stroke(col);
      // Removing shadow properties for WEBGL compatibility
      // drawingContext.shadowColor = color(hue(col), saturation(col), brightness(col), 50).toString();
      // drawingContext.shadowBlur = 10;
      vertex(p1.x, p1.y);
      vertex(p2.x, p2.y);
    }
    endShape();
  }
  // drawingContext.shadowBlur = 0; // Reset shadow blur
}
Line-by-line explanation (13 lines)

🔧 Subcomponents:

conditional Early Return Guard if (points.length === 0) return;

Prevents trying to draw when no points exist, avoiding errors and unnecessary computation

conditional-and-loop Crystallized Point Rendering if (crystallized || points.length < 2) {

Draws points as individual dots (POINTS mode) when crystallized mode is on or when there's only 1 point

loop Smooth Line Drawing Loop for (let i = 0; i < points.length - 1; i++) {

Connects consecutive points with line segments and colors them from the palette with animation

calculation Palette Cycling Index let col = palette[floor(frameCount * settings.colorCyclingSpeed + i) % palette.length];

Picks a color from the palette that shifts every frame, creating a flowing rainbow effect along the strokes

if (points.length === 0) return;
If there are no drawing points yet (user hasn't drawn anything), exit the function immediately. This avoids trying to iterate over an empty array.
if (crystallized || points.length < 2) {
If crystallized mode is enabled OR if there's only 1 point (can't draw a line with just 1 point), use POINTS mode (individual dots) instead of lines.
beginShape(POINTS);
Starts a shape in POINTS mode, which draws vertices as individual pixels or small dots rather than connecting them with lines.
for (let point of points) {
Loops through every point in the drawingPoints array using a for...of loop, which is clean syntax for iterating over array values.
let col = palette[floor(frameCount * settings.colorCyclingSpeed + points.indexOf(point)) % palette.length];
Calculates which color from the palette to use. frameCount increases each frame, so this color index shifts, creating animation. The % palette.length wraps the index back to 0 when it exceeds the palette size. points.indexOf(point) gives each point a unique offset for wave-like color effects.
stroke(col);
Sets the stroke color to the calculated palette color. From this point forward, all shapes drawn use this color until stroke() is called again.
vertex(point.x, point.y);
Adds a vertex (point) to the shape at the coordinates (point.x, point.y). Multiple vertices define the shape's geometry.
endShape();
Finishes the shape definition and renders it to the canvas with all the vertices and colors specified.
beginShape(LINES);
Starts a shape in LINES mode, which connects consecutive pairs of vertices with line segments instead of rendering individual dots.
for (let i = 0; i < points.length - 1; i++) {
Loops from 0 to points.length - 2 (the second-to-last point). We stop at - 1 because we need pairs of points to draw a line between them.
let p1 = points[i];
Gets the current point from the array.
let p2 = points[i+1];
Gets the next point in the array. Together, p1 and p2 form one line segment.
vertex(p1.x, p1.y); vertex(p2.x, p2.y);
Adds two vertices to the LINES shape. In LINES mode, every pair of vertices is drawn as a single line segment, so this creates one small line from p1 to p2.

drawSymmetryLines()

drawSymmetryLines() is a simple helper that visualizes the mirror axes. It reuses the same angle-based loop pattern as draw() but draws only white guide lines. This is optional visual feedback toggled by showSymmetryLines in the GUI and helps users understand the symmetry structure of the pattern they're creating.

function drawSymmetryLines() {
  let angle = TWO_PI / settings.symmetryCount;
  let radius = min(width, height) / 2; // Radius to draw lines to

  for (let i = 0; i < settings.symmetryCount; i++) {
    push();
    rotateZ(i * angle);
    stroke(255, 50); // Semi-transparent white lines
    line(0, 0, radius, 0); // Draw line from center to edge
    pop();
  }
}
Line-by-line explanation (8 lines)

🔧 Subcomponents:

for-loop Radial Line Drawing Loop for (let i = 0; i < settings.symmetryCount; i++) {

Draws one guide line for each symmetry axis, rotated to show where the mirrors are positioned

let angle = TWO_PI / settings.symmetryCount;
Calculates the angle between each symmetry axis—same calculation as in draw(). For 6 symmetries, this is 60°.
let radius = min(width, height) / 2;
Sets the line length to half the smaller canvas dimension, ensuring lines fit nicely within the viewable area without hitting the edges.
for (let i = 0; i < settings.symmetryCount; i++) {
Loops once for each symmetry axis, drawing one radial line per iteration.
push();
Saves the current transformation matrix before applying the rotation for this specific line.
rotateZ(i * angle);
Rotates the coordinate system so each line points in a different direction—0°, 60°, 120°, etc.
stroke(255, 50);
Sets stroke color to white (HSB: 255 hue, but since we're at full saturation and brightness, this is white) with 50% alpha (semi-transparent). In HSB, a hue value above 360 wraps, and full saturation/brightness always gives a vivid color.
line(0, 0, radius, 0);
Draws a line from the center (0, 0) to (radius, 0). Since we just rotated, this line points in the current slice's direction. The line goes horizontal in the current coordinate frame and radiates from the center after rotation.
pop();
Restores the transformation matrix so the next iteration starts fresh without accumulated rotations.

generatePalette()

generatePalette() demonstrates color theory in code: it creates a harmonious 6-color palette using triad (base hue + three shades), complementary (opposite on the wheel), and analogous (nearby) colors. This function is called at startup and automatically every 500 drawing points, giving the sketch an ever-refreshing palette. The shuffle at the end ensures colors cycle in an unpredictable order, making animations feel more organic.

🔬 These lines add colors 30° away from the base hue. What happens if you change 30 to 60? You'll get hues further apart, making the palette more diverse. What if you add a third line that adds a triad at (baseHue + 120) % 360?

  // Add analogous hues
  palette.push(color((baseHue + 30) % 360, 70, 80));
  palette.push(color((baseHue - 30 + 360) % 360, 70, 80));
function generatePalette() {
  palette = [];
  // Pick a random base hue (0-360)
  let baseHue = random(360);

  // Generate a harmonious palette (e.g., analogous or complementary)
  // For this example, let's create a triad palette with variations.
  palette.push(color(baseHue, 80, 90)); // Bright jewel tone
  palette.push(color(baseHue, 60, 70)); // Slightly darker
  palette.push(color(baseHue, 40, 50)); // Even darker

  // Add a complementary hue for contrast
  let complementaryHue = (baseHue + 180) % 360;
  palette.push(color(complementaryHue, 80, 90));

  // Add analogous hues
  palette.push(color((baseHue + 30) % 360, 70, 80));
  palette.push(color((baseHue - 30 + 360) % 360, 70, 80));

  // Shuffle the palette for more varied color cycling
  palette = shuffle(palette);

  console.log('New color palette generated:', palette.map(c => c.toString()));
}
Line-by-line explanation (11 lines)

🔧 Subcomponents:

calculation Random Base Hue Selection let baseHue = random(360);

Picks a random starting hue (0-360°) that determines the overall color theme

loop-and-calculation Harmonic Color Generation palette.push(color(...));

Builds a palette with variations: shades of the base hue, plus complementary (opposite) and analogous (nearby) hues

function-call Palette Randomization palette = shuffle(palette);

Randomizes the order of colors so they cycle in a less predictable sequence

palette = [];
Clears the palette array by creating a new empty array, discarding any previous colors.
let baseHue = random(360);
Picks a random hue value between 0 and 360 (full spectrum). This becomes the theme color for the entire palette.
palette.push(color(baseHue, 80, 90));
Creates a bright, saturated color (hue = baseHue, saturation = 80%, brightness = 90%) and adds it to the palette. This is a vivid jewel tone.
palette.push(color(baseHue, 60, 70));
Adds a slightly darker and less saturated version of the base hue. This creates tonal variety within the same color family.
palette.push(color(baseHue, 40, 50));
Adds an even darker, more muted version. Now the palette has three shades of the base hue for depth.
let complementaryHue = (baseHue + 180) % 360;
Calculates the complementary (opposite) hue by adding 180°. The % 360 ensures the result wraps back to 0-360 if it exceeds 360.
palette.push(color(complementaryHue, 80, 90));
Adds a bright complementary color. Complementary colors sit opposite each other on the color wheel and create high visual contrast.
palette.push(color((baseHue + 30) % 360, 70, 80));
Adds an analogous hue (30° clockwise from the base). Analogous colors sit next to each other on the wheel and create harmonious, pleasing combinations.
palette.push(color((baseHue - 30 + 360) % 360, 70, 80));
Adds another analogous hue (30° counter-clockwise). The + 360 before % 360 ensures we don't get negative hue values.
palette = shuffle(palette);
Randomizes the order of the 6 colors in the palette array. This makes the color cycling less predictable and more interesting visually.
console.log('New color palette generated:', palette.map(c => c.toString()));
Logs the generated palette to the browser console for debugging. map(c => c.toString()) converts each color object to a human-readable string.

mousePressed()

mousePressed() fires once when the user clicks (or touches on mobile via touchStarted()). It clears the drawing array and starts a fresh stroke. The coordinate transformation (mouseX - width/2) is crucial: WEBGL centers the origin at the canvas middle, while mouseX is measured from the top-left, so we must translate between the two coordinate systems.

function mousePressed() {
  // Clear drawingPoints to start a new stroke
  drawingPoints = [];
  // Add the initial point
  drawingPoints.push(createVector(mouseX - width / 2, mouseY - height / 2));
}
Line-by-line explanation (2 lines)
drawingPoints = [];
Clears the drawingPoints array by creating a new empty array. This starts a fresh stroke, erasing the previous drawing line.
drawingPoints.push(createVector(mouseX - width / 2, mouseY - height / 2));
Creates a p5.Vector at the mouse position, adjusted for WEBGL coordinates. In WEBGL, (0,0) is at the canvas center, not the top-left, so we subtract width/2 and height/2 to convert from screen coordinates to canvas coordinates. This vector is added to the array as the first point of the new stroke.

mouseDragged()

mouseDragged() is called continuously while the mouse button is held down. Each call adds the current position to the drawing array, building up a smooth trail of points. The palette auto-refresh every 500 points is a clever way to keep color schemes fresh without manual interaction, and it demonstrates the modulo operator (%) for interval-based triggering.

function mouseDragged() {
  // Add current mouse position to drawingPoints array
  drawingPoints.push(createVector(mouseX - width / 2, mouseY - height / 2));

  // Simple "AI" complexity analysis: Suggest new palette every 500 points
  if (drawingPoints.length % 500 === 0) {
    generatePalette();
    console.log('AI suggested a new palette based on pattern complexity!');
  }
}
Line-by-line explanation (4 lines)

🔧 Subcomponents:

conditional Auto-Palette Generation Trigger if (drawingPoints.length % 500 === 0) {

Every 500 points drawn, automatically calls generatePalette() to suggest a fresh color scheme

drawingPoints.push(createVector(mouseX - width / 2, mouseY - height / 2));
Adds the current mouse position to the drawing array. Because mouseDragged() fires many times per second while the mouse is held down, this creates a smooth continuous line of points.
if (drawingPoints.length % 500 === 0) {
Checks if the total number of points is a multiple of 500 (500, 1000, 1500, etc.). The % operator returns the remainder, so % 500 === 0 is true every 500 points.
generatePalette();
Generates a new random palette. The 'AI' aspect is somewhat tongue-in-cheek—it's not actually analyzing the drawing; it's just suggesting a fresh palette at regular intervals.
console.log('AI suggested a new palette based on pattern complexity!');
Logs a message to the browser console so the user knows a palette change happened (visible if they open the developer console).

touchStarted()

touchStarted() fires when a touch begins on mobile devices. By returning false, it prevents the browser from handling the touch event normally (scrolling, zooming, etc.), allowing the sketch to fully capture and use the touch input. This is paired with touchMoved() to handle drawing.

function touchStarted() {
  // Prevent default browser behavior (e.g., scrolling)
  return false;
}
Line-by-line explanation (1 lines)
return false;
Returns false to prevent the browser's default behavior for touch events, such as scrolling or zooming. This ensures the sketch captures touch input without interference.

touchMoved()

touchMoved() mirrors mouseDragged() for mobile devices. It captures touch input and adds positions to the drawing array, enabling the same drawing-on-drag experience on touchscreens. The palette auto-refresh is identical to the mouse version, and returning false prevents browser interference with the sketch's touch handling.

function touchMoved() {
  // Record touch positions similar to mouseDragged
  drawingPoints.push(createVector(touchX - width / 2, touchY - height / 2));

  // Simple "AI" complexity analysis: Suggest new palette every 500 points
  if (drawingPoints.length % 500 === 0) {
    generatePalette();
    console.log('AI suggested a new palette based on pattern complexity!');
  }

  // Prevent default browser behavior (e.g., scrolling)
  return false;
}
Line-by-line explanation (3 lines)

🔧 Subcomponents:

conditional Auto-Palette Generation on Touch if (drawingPoints.length % 500 === 0) {

Same as mouseDragged() but triggered by touch input instead

drawingPoints.push(createVector(touchX - width / 2, touchY - height / 2));
Adds the current touch position to the drawing array. touchX and touchY are p5.js variables that track the most recent touch location, similar to mouseX/mouseY but for mobile devices.
if (drawingPoints.length % 500 === 0) {
Same palette-refresh logic as mouseDragged()—every 500 points, a new palette is generated.
return false;
Prevents the browser from handling the touch event, ensuring the sketch maintains full control and doesn't trigger scrolling or other browser behaviors.

windowResized()

windowResized() is a built-in p5.js function that fires whenever the browser window is resized. It's essential for responsive sketches—without it, the canvas would stay at its original size and not adapt to full-screen viewing on different devices.

function windowResized() {
  resizeCanvas(windowWidth, windowHeight);
}
Line-by-line explanation (1 lines)
resizeCanvas(windowWidth, windowHeight);
Resizes the p5.js canvas to match the new window dimensions whenever the browser window is resized. This keeps the sketch full-screen and responsive to window size changes.

deviceMoved()

deviceMoved() fires whenever the device's orientation changes (on mobile phones with motion sensors). It updates global variables that are later used in draw() to subtly rotate the kaleidoscope pattern based on how the user tilts their phone. On desktop browsers, this has no effect, so it's safe to include for all users.

function deviceMoved() {
  // Update device rotation variables
  // rotationX: tilt front/back (-180 to 180)
  // rotationY: tilt left/right (-90 to 90)
  deviceRotationX = rotationX;
  deviceRotationY = rotationY;
}
Line-by-line explanation (2 lines)
deviceRotationX = rotationX;
Captures the device's tilt forward/backward (pitch) from the phone's accelerometer/gyroscope. p5.js provides rotationX as a global variable; this just copies it to a local variable for use in draw().
deviceRotationY = rotationY;
Captures the device's tilt left/right (roll). On desktop, these values stay at 0; on mobile devices with sensors, they reflect actual phone tilt.

📦 Key Variables

drawingPoints array

Stores all the points the user has drawn as p5.Vector objects. These points are multiplied and reflected to create the kaleidoscope effect.

let drawingPoints = [];
palette array

Stores the generated color palette—typically 6 colors in HSB mode. Used by drawStroke() to cycle colors along the strokes.

let palette = [];
gui object

The dat.GUI control panel object that lets users adjust symmetry, speed, colors, and other settings without editing code.

let gui;
settings object

A settings object holding all adjustable parameters (symmetryCount, rotationSpeed, colorCyclingSpeed, showSymmetryLines, isCrystallized) and functions (clearCanvas, suggestPalette). Bound to the dat.GUI controls.

let settings = { symmetryCount: 6, rotationSpeed: 0.005, ... };
deviceRotationX number

Stores the device's forward/backward tilt angle from the phone's accelerometer, used to subtly rotate the pattern. Desktop browsers keep this at 0.

let deviceRotationX = 0;
deviceRotationY number

Stores the device's left/right tilt angle from the phone's gyroscope, used to subtly rotate the pattern. Desktop browsers keep this at 0.

let deviceRotationY = 0;

🔧 Potential Improvements (5)

Here are some ways this code could be enhanced:

BUG drawStroke() function

The expression points.indexOf(point) is inefficient and can be slow when the array is large (1000+ points). It searches the entire array for each point, resulting in O(n²) complexity.

💡 Use a traditional for-loop index instead: 'for (let i = 0; i < points.length; i++) { let point = points[i]; ... let col = palette[floor(frameCount * settings.colorCyclingSpeed + i) % palette.length]; }' This avoids repeated searches.

PERFORMANCE draw() function

The background(0) call clears the entire canvas every frame, but strokes accumulate in drawingPoints indefinitely. As the array grows to thousands of points, rendering slows down significantly.

💡 Implement a point limit or allow users to fade old points. For example, keep only the last 2000 points: 'if (drawingPoints.length > 2000) drawingPoints.shift();' This caps memory and rendering load.

FEATURE generatePalette() function

The palette is randomly shuffled, making color sequences unpredictable. Users cannot control or repeat a favorite color scheme once it's gone.

💡 Add a 'Save Palette' button in the GUI that stores the current palette to localStorage, and a 'Load Palette' button to restore it. This lets users preserve beautiful schemes they discover.

STYLE Overall

The settings object mixes configuration values (symmetryCount, rotationSpeed) with methods (clearCanvas, suggestPalette), making it less organized.

💡 Separate configuration and methods into two objects: one for settings (numbers) and one for actions (functions). This is clearer: settings.symmetryCount and actions.clearCanvas().

BUG mouseDragged() and touchMoved()

Both functions call generatePalette() every time drawingPoints.length is a multiple of 500, but the palette swap can be jarring mid-stroke and interrupt the visual flow.

💡 Add a check to only auto-generate if the user has paused drawing for a moment, or trigger palettes only on mousePressed/touchStarted instead of during continuous motion.

🔄 Code Flow

Code flow showing setup, draw, drawstroke, drawsymmetrylines, generatepalette, mousepressed, mousedragged, touchstarted, touchmoved, windowresized, devicemoved

💡 Click on function names in the diagram to jump to their code

graph TD start[Start] --> setup[setup] setup --> draw[draw loop] click setup href "#fn-setup" click draw href "#fn-draw" draw --> emptycheck[Early Return Guard] emptycheck --> globalrotationloop[Symmetry Multiplication Loop] globalrotationloop --> reflectionwithmirror[Horizontal Reflection] reflectionwithmirror --> symmetrylinesconditional[Optional Symmetry Guide Lines] symmetrylinesconditional --> drawstroke[drawStroke] drawstroke --> crystallizedmodeloop[Crystallized Point Rendering] crystallizedmodeloop --> smoothlineloop[Smooth Line Drawing Loop] smoothlineloop --> colorcycling[Palette Cycling Index] click emptycheck href "#sub-empty-check" click globalrotationloop href "#sub-global-rotation-loop" click reflectionwithmirror href "#sub-reflection-with-mirror" click symmetrylinesconditional href "#sub-symmetry-lines-conditional" click drawstroke href "#fn-drawstroke" click crystallizedmodeloop href "#sub-crystallized-mode-loop" click smoothlineloop href "#sub-smooth-line-loop" click colorcycling href "#sub-color-cycling" setup --> canvascreation[WEBGL Canvas Setup] setup --> colormodesetup[HSB Color Mode Configuration] setup --> guiinitialization[dat.GUI Control Panel Setup] click canvascreation href "#sub-canvas-creation" click colormodesetup href "#sub-color-mode-setup" click guiinitialization href "#sub-gui-initialization" drawstroke --> palettetrigger[Auto-Palette Generation Trigger] palettetrigger --> generatepalette[generatePalette] generatepalette --> palettebuilding[Harmonic Color Generation] palettebuilding --> basehuegeneration[Random Base Hue Selection] basehuegeneration --> palettebuilding palettebuilding --> paletteshuffle[Palette Randomization] paletteshuffle --> drawstroke click palettetrigger href "#sub-palette-trigger" click generatepalette href "#fn-generatepalette" click palettebuilding href "#sub-palette-building" click basehuegeneration href "#sub-base-hue-generation" click paletteshuffle href "#sub-palette-shuffle" mousedragged --> touchpalettetrigger[Auto-Palette Generation on Touch] touchpalettetrigger --> drawstroke click touchpalettetrigger href "#sub-touch-palette-trigger" setup --> windowresized[windowResized] setup --> devicemoved[deviceMoved] click windowresized href "#fn-windowresized" click devicemoved href "#fn-devicemoved"

❓ Frequently Asked Questions

What kind of visual art does the AI Kaleidoscope Generator create?

The AI Kaleidoscope Generator produces mesmerizing, symmetrical patterns that swirl and morph dynamically with user interactions, creating glowing kaleidoscopic designs.

How can users customize their experience with the sketch?

Users can interact with the sketch by adjusting various parameters in the control panel, such as symmetry count, rotation speed, and color cycling, as well as by using their mouse to draw patterns.

What creative coding techniques are showcased in this p5.js sketch?

This sketch demonstrates techniques such as real-time drawing, color cycling, and symmetry manipulation to create visually stunning and interactive art.

Preview

AI Kaleidoscope Generator - Symmetrical Pattern Art Draw mesmerizing symmetrical patterns with real (Remix) - p5.js creative coding sketch preview
Sketch Preview
Code flow diagram showing the structure of AI Kaleidoscope Generator - Symmetrical Pattern Art Draw mesmerizing symmetrical patterns with real (Remix) - Code flow showing setup, draw, drawstroke, drawsymmetrylines, generatepalette, mousepressed, mousedragged, touchstarted, touchmoved, windowresized, devicemoved
Code Flow Diagram