
Rainbow Spirograph - xelsed.ai

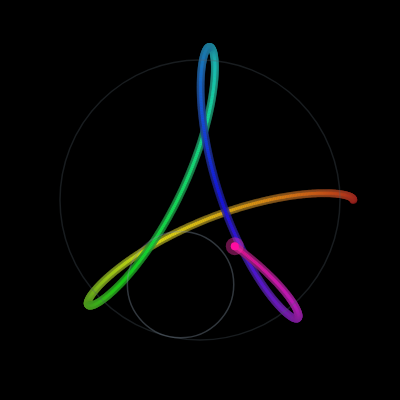
This sketch draws an animated spirograph using the hypotrochoid equation - the classic 'circle rolling inside a circle' curve. A glowing rainbow line is traced point by point onto a persistent off-screen layer, so the pattern slowly builds into an intricate, colorful geometric artwork over time.

🧪 Try This!

Experiment with the code by making these changes:

  1. Speed up the drawing — Increasing the angle step makes the pen jump further each frame, causing the whole pattern to trace out much faster.
  2. Make the pattern loopier — Increasing the pen offset relative to the inner circle radius makes the curve trace wilder, more overlapping loops instead of smooth petals.
  3. Cycle colors faster — Raising the hue increment makes the rainbow gradient shift much more quickly along the drawn path, producing tighter color bands.
Prefer the full editor? Open it there →

📖 About This Sketch

This sketch generates a mesmerizing, ever-growing spirograph pattern by plotting the classic hypotrochoid curve - the path traced by a point on a small circle rolling inside a larger fixed circle. Instead of redrawing from scratch each frame, it accumulates the rainbow, glowing line onto a separate off-screen buffer using createGraphics(), so the artwork keeps building layer upon layer without ever being erased. The color constantly shifts using HSB color mode, and a double-stroke technique (a thick faint line plus a thin bright core) creates a convincing neon glow effect.

The code is organized around four functions: setup() prepares the canvas and the persistent drawing layer, initSpiroParams() calculates the spirograph's geometry from the current window size, draw() runs the parametric math every frame and paints new segments, and windowResized() rebuilds everything if the browser window changes size. Studying this sketch teaches you parametric equations, HSB color cycling, offscreen graphics buffers, and how splitting 'ephemeral' visuals (the circles and pen) from 'permanent' visuals (the traced path) lets you build up complex generative art over time.

⚙️ How It Works

  1. When the sketch loads, setup() creates a full-window canvas in HSB color mode and also creates a second, identical-sized graphics buffer called pathLayer that will hold the permanent drawing.
  2. initSpiroParams() then calculates the sizes of the outer circle (R), inner rolling circle (r), and pen offset (d) based on the window's smaller dimension, and resets the animation parameter t to zero.
  3. Every frame, draw() clears the main canvas to black (but NOT the pathLayer), then loops a few small time-steps forward, computing the hypotrochoid x/y position at each step using cosine and sine.
  4. For each tiny step, two overlapping lines - a thick low-alpha 'glow' stroke and a thin high-alpha 'core' stroke - are drawn onto the pathLayer in a shifting hue, which is what accumulates into the final intricate pattern.
  5. The accumulated pathLayer image is then stamped onto the main canvas every frame, and on top of it draw() also renders temporary, non-accumulating visuals: the outer fixed circle, the inner rolling circle, and a glowing pen marker at the current drawing point.
  6. If the browser window is resized, windowResized() rebuilds the canvas and pathLayer at the new size and calls initSpiroParams() again, which restarts the pattern from scratch.

🎓 Concepts You'll Learn

Parametric equations (hypotrochoid)HSB color mode and alpha transparencyOffscreen graphics buffers (createGraphics)Layered rendering (persistent vs ephemeral drawing)Animation loop and incremental angle steppingTrigonometry (sin/cos) for circular motion

📝 Code Breakdown

setup()

setup() runs once when the sketch starts. Here it's used not just to create the visible canvas but also a second, hidden graphics buffer (pathLayer) - a common p5.js pattern for building up a drawing over time without redrawing everything each frame.

function setup() {
  createCanvas(windowWidth, windowHeight);
  colorMode(HSB, 360, 100, 100, 100); // HSB with alpha 0–100
  smooth();

  // Layer that accumulates the drawing over time
  pathLayer = createGraphics(windowWidth, windowHeight);
  pathLayer.colorMode(HSB, 360, 100, 100, 100);
  pathLayer.background(0, 0, 0); // black
  pathLayer.smooth();
  pathLayer.strokeCap(ROUND);

  initSpiroParams();
}
Line-by-line explanation (8 lines)
createCanvas(windowWidth, windowHeight);
Creates a canvas that fills the entire browser window.
colorMode(HSB, 360, 100, 100, 100);
Switches the main canvas to Hue-Saturation-Brightness color mode with ranges 0-360 for hue and 0-100 for saturation, brightness and alpha, which makes it easy to cycle through rainbow colors by just changing the hue number.
smooth();
Enables anti-aliasing so lines and circles look smooth instead of jagged.
pathLayer = createGraphics(windowWidth, windowHeight);
Creates a separate, invisible-until-drawn graphics buffer the same size as the canvas - this is where the permanent spirograph trail will live.
pathLayer.colorMode(HSB, 360, 100, 100, 100);
Sets the same HSB color mode on the buffer, since each graphics object has its own independent color settings.
pathLayer.background(0, 0, 0); // black
Fills the buffer with black once, giving the drawing a dark background to build up on.
pathLayer.strokeCap(ROUND);
Makes the ends of every line segment rounded instead of flat, which helps the glowing strokes blend smoothly into each other.
initSpiroParams();
Calls the helper function that calculates the spirograph's geometry (circle sizes, pen offset, starting position) based on the current canvas size.
initSpiroParams()

This function shows how generative art often separates 'setup math' (computed once) from 'per-frame math' (computed every draw call) for efficiency - and how ratios between values, not just absolute sizes, determine the character of a pattern.

🔬 These three ratios shape the whole pattern. What happens if you change r's ratio from 0.38 to 0.1 (a much smaller inner circle) or to 0.7? Does the pattern get more or fewer 'petals'?

  R = minDim * 0.35;   // big circle radius
  r = R * 0.38;        // small circle radius
  d = r * 1.25;        // pen offset from center of inner circle
function initSpiroParams() {
  centerX = width / 2;
  centerY = height / 2;

  const minDim = min(width, height);

  // Tuned values for interesting, intricate patterns:
  R = minDim * 0.35;   // big circle radius
  r = R * 0.38;        // small circle radius
  d = r * 1.25;        // pen offset from center of inner circle

  k = (R - r) / r;     // angle ratio

  // Start param
  t = 0;

  // Initial pen position at t = 0
  const x0 = centerX + (R - r) + d; // cos(0) = 1
  const y0 = centerY;               // sin(0) = 0
  prevX = x0;
  prevY = y0;

  hueVal = 0;
}
Line-by-line explanation (11 lines)

🔧 Subcomponents:

calculation Circle Geometry Setup R = minDim * 0.35; r = R * 0.38; d = r * 1.25;

Derives the outer circle radius, inner circle radius, and pen offset from the canvas size, in proportions tuned to look intricate.

calculation Initial Pen Position const x0 = centerX + (R - r) + d;

Computes where the pen starts (at angle t=0) so the first line segment in draw() has a valid starting point.

centerX = width / 2;
Finds the horizontal center of the canvas, which the whole spirograph will be built around.
centerY = height / 2;
Finds the vertical center of the canvas.
const minDim = min(width, height);
Takes the smaller of width and height so the spirograph always fits on screen, even on narrow or short windows.
R = minDim * 0.35; // big circle radius
Sets the fixed outer circle's radius to 35% of the smaller screen dimension.
r = R * 0.38; // small circle radius
Sets the rolling inner circle's radius to 38% of the outer circle - this ratio determines how many 'petals' the final pattern has.
d = r * 1.25; // pen offset from center of inner circle
Sets how far the pen sits from the inner circle's center - larger than r means the pen traces loops instead of smooth curves.
k = (R - r) / r; // angle ratio
Precomputes the ratio used in the hypotrochoid formula so it doesn't need to be recalculated every frame.
t = 0;
Resets the animation's angle parameter back to the start.
const x0 = centerX + (R - r) + d; // cos(0) = 1
Calculates the pen's starting x position by plugging t=0 into the hypotrochoid formula (where cos(0) simplifies to 1).
prevX = x0;
Stores this starting position so draw() knows where to begin the first line segment.
hueVal = 0;
Resets the color cycle back to the start of the rainbow (red/hue 0).

draw()

draw() demonstrates a key generative-art technique: separating what should persist (drawn to pathLayer, never cleared) from what should be ephemeral (drawn straight to the main canvas, cleared every frame). This lets you build up complex artwork over time while still showing live, moving indicators on top.

🔬 This is the outer 'glow' stroke - thick and semi-transparent. What happens if you set the alpha (the 4th number, currently 35) all the way up to 100? Does the glow effect disappear?

    pathLayer.stroke(hueVal, 80, 60, 35); // hue, sat, bright, alpha (0–100)
    pathLayer.strokeWeight(8);
    pathLayer.line(prevX, prevY, x, y);

🔬 This loop draws stepsPerFrame segments each frame. What happens if you change t += 0.01 to a much bigger jump like t += 0.1? Does the curve still look smooth?

  for (let i = 0; i < stepsPerFrame; i++) {
    t += 0.01; // Smaller = slower drawing, more detailed animation
function draw() {
  // Clear the main canvas each frame, but NOT the pathLayer
  background(0, 0, 0); // black (HSB: hue=0, sat=0, bright=0)

  // Draw multiple small steps per frame for a smoother curve
  const stepsPerFrame = 4;
  for (let i = 0; i < stepsPerFrame; i++) {
    t += 0.01; // Smaller = slower drawing, more detailed animation

    // Hypotrochoid parametric equations (inner circle rolling inside outer)
    // x(θ) = (R - r) cos θ + d cos(((R - r)/r) θ)
    // y(θ) = (R - r) sin θ - d sin(((R - r)/r) θ)
    const cosT = cos(t);
    const sinT = sin(t);
    const angle2 = k * t;
    const cos2 = cos(angle2);
    const sin2 = sin(angle2);

    const x = centerX + (R - r) * cosT + d * cos2;
    const y = centerY + (R - r) * sinT - d * sin2;

    // Advance hue for a smooth gradient as we draw
    hueVal = (hueVal + 0.4) % 360;

    // --- Glowing line on the path layer ---

    // Outer "glow" stroke (thicker, lower alpha)
    pathLayer.stroke(hueVal, 80, 60, 35); // hue, sat, bright, alpha (0–100)
    pathLayer.strokeWeight(8);
    pathLayer.line(prevX, prevY, x, y);

    // Inner bright core stroke (thinner, higher alpha)
    pathLayer.stroke(hueVal, 95, 100, 100);
    pathLayer.strokeWeight(3);
    pathLayer.line(prevX, prevY, x, y);

    prevX = x;
    prevY = y;
  }

  // Draw the accumulated path
  image(pathLayer, 0, 0);

  // --- Visualize the circles and pen on top (ephemeral) ---

  // Outer fixed circle
  noFill();
  stroke(210, 20, 40, 30); // faint bluish outline
  strokeWeight(1.5);
  circle(centerX, centerY, 2 * R);

  // Position of inner rolling circle center
  const innerCX = centerX + (R - r) * cos(t);
  const innerCY = centerY + (R - r) * sin(t);

  // Inner rolling circle
  stroke(210, 20, 60, 40);
  strokeWeight(1.5);
  circle(innerCX, innerCY, 2 * r);

  // Pen (current drawing point)
  noStroke();
  // Soft halo for glow
  fill(hueVal, 80, 100, 40);
  circle(prevX, prevY, 18);

  // Solid core of the pen
  fill(hueVal, 95, 100, 100);
  circle(prevX, prevY, 8);
}
Line-by-line explanation (18 lines)

🔧 Subcomponents:

for-loop Sub-Stepping Loop for (let i = 0; i < stepsPerFrame; i++) {

Runs the curve math multiple times per frame so the line advances further each frame while keeping each individual segment short and smooth.

calculation Hypotrochoid Position Calculation const x = centerX + (R - r) * cosT + d * cos2; const y = centerY + (R - r) * sinT - d * sin2;

Computes the pen's exact x,y position for the current angle t using the hypotrochoid parametric formula.

calculation Glow + Core Double Stroke pathLayer.stroke(hueVal, 80, 60, 35); pathLayer.strokeWeight(8); pathLayer.line(prevX, prevY, x, y);

Draws a thick, low-opacity line first to create a soft glow, then a thin bright line on top for a neon light effect.

background(0, 0, 0); // black (HSB: hue=0, sat=0, bright=0)
Repaints the main (visible) canvas black every frame - this only clears the temporary circle/pen visuals, not the accumulated path, since pathLayer is a separate buffer.
const stepsPerFrame = 4;
Defines how many tiny curve segments get computed and drawn within a single frame, making the line appear to move further per frame without looking jagged.
t += 0.01; // Smaller = slower drawing, more detailed animation
Advances the angle parameter that drives the whole curve - this is the 'clock' of the animation.
const x = centerX + (R - r) * cosT + d * cos2;
Applies the hypotrochoid x-formula to find the pen's horizontal position at the current angle.
const y = centerY + (R - r) * sinT - d * sin2;
Applies the hypotrochoid y-formula (note the minus sign) to find the pen's vertical position.
hueVal = (hueVal + 0.4) % 360;
Increments the hue value and wraps it back to 0 once it passes 360, creating a continuously cycling rainbow color.
pathLayer.stroke(hueVal, 80, 60, 35); // hue, sat, bright, alpha (0–100)
Sets a semi-transparent, medium-brightness stroke color on the buffer for the outer glow layer of the line.
pathLayer.strokeWeight(8);
Makes this glow stroke thick so it spreads out around the core line.
pathLayer.line(prevX, prevY, x, y);
Draws the glow segment from the previous pen position to the new one, onto the persistent pathLayer buffer.
pathLayer.stroke(hueVal, 95, 100, 100);
Sets a fully opaque, near-maximum-brightness color for the bright core of the line.
pathLayer.strokeWeight(3);
Makes the core stroke thin so it sits crisply inside the wider glow stroke.
prevX = x;
Saves the current position as the 'previous' one, so the next tiny step draws a connected line segment starting here.
image(pathLayer, 0, 0);
Stamps the entire accumulated pathLayer buffer onto the visible canvas at position (0,0), showing everything drawn so far.
circle(centerX, centerY, 2 * R);
Draws a faint outline of the fixed outer circle directly on the main canvas - this is redrawn fresh every frame and not saved to pathLayer, so it doesn't accumulate.
const innerCX = centerX + (R - r) * cos(t);
Calculates where the center of the rolling inner circle currently is, based on the current angle t.
circle(innerCX, innerCY, 2 * r);
Draws the rolling inner circle at its current position, giving a visual sense of the mechanism generating the curve.
fill(hueVal, 80, 100, 40);
Sets a soft, semi-transparent glow color for the halo drawn around the pen.
circle(prevX, prevY, 8);
Draws a small, fully opaque solid circle marking exactly where the pen currently is.

windowResized()

This is p5.js's built-in callback that automatically fires whenever the browser window is resized. It's essential for responsive sketches - here it shows the tradeoff that resizing forces the accumulated artwork to restart, since the buffer's pixel dimensions can't change without losing or distorting existing content.

function windowResized() {
  resizeCanvas(windowWidth, windowHeight);

  // Rebuild the path layer to match new size (pattern restarts)
  pathLayer = createGraphics(windowWidth, windowHeight);
  pathLayer.colorMode(HSB, 360, 100, 100, 100);
  pathLayer.background(0, 0, 0);
  pathLayer.smooth();
  pathLayer.strokeCap(ROUND);

  initSpiroParams();
}
Line-by-line explanation (4 lines)
resizeCanvas(windowWidth, windowHeight);
Resizes the main visible canvas to match the browser window's new dimensions.
pathLayer = createGraphics(windowWidth, windowHeight);
Creates a brand new graphics buffer at the new size - the old one (with the previous drawing) is discarded, since a differently-sized buffer can't simply be stretched without distortion.
pathLayer.background(0, 0, 0);
Fills the new buffer with black so it starts as a blank canvas again.
initSpiroParams();
Recalculates the spirograph's geometry to fit the new window size and resets the pen position and animation angle to the start.

📦 Key Variables

R number

Radius of the fixed outer circle that the smaller circle rolls around inside of.

let R;
r number

Radius of the rolling inner circle - its ratio to R determines the pattern's number of loops/petals.

let r;
d number

Distance from the inner circle's center to the pen point - controls how 'loopy' versus smooth the curve looks.

let d;
k number

Precomputed ratio (R-r)/r used inside the hypotrochoid formula to avoid recalculating it every frame.

let k;
t number

The animation's angle parameter (in radians) that continuously increases to drive the pen around the curve.

let t = 0;
prevX number

The pen's previous x position, used as the starting point of each new line segment drawn.

let prevX;
prevY number

The pen's previous y position, used as the starting point of each new line segment drawn.

let prevY;
centerX number

The horizontal center of the canvas, around which the whole spirograph is built.

let centerX;
centerY number

The vertical center of the canvas, around which the whole spirograph is built.

let centerY;
hueVal number

The current hue (0-360) used to color the line, continuously advanced to create a rainbow gradient effect.

let hueVal = 0;
pathLayer object

An off-screen p5.Graphics buffer that stores the permanently accumulated spirograph drawing, separate from the main canvas which is cleared every frame.

let pathLayer;

🔧 Potential Improvements (4)

Here are some ways this code could be enhanced:

FEATURE draw()

The spirograph's shape (R, r, d ratios) is fixed at setup and can't be changed interactively.

💡 Add mouse or keyboard controls (e.g. mouseX/mouseY mapped to the r or d ratio) so viewers can reshape the pattern live instead of only seeing one fixed configuration.

BUG windowResized()

Resizing the window completely discards the accumulated pathLayer drawing, abruptly restarting the pattern, which can be jarring if a user resizes mid-drawing.

💡 Consider copying the old pathLayer image onto the new, larger buffer with image() before discarding it, so existing artwork is preserved (even if not perfectly centered).

PERFORMANCE draw()

stroke() and strokeWeight() are called twice per sub-step (once for glow, once for core) inside a loop that runs stepsPerFrame times every frame, which is a moderate but avoidable amount of redundant state-setting work.

💡 Since these values only depend on hueVal, you could batch line segments by hue less frequently, or accept the minor cost since p5.js state calls are already fairly cheap - a debugging tip worth knowing when optimizing more complex sketches.

STYLE draw()

Magic numbers like 80, 60, 35, 95, 100 for stroke colors are inlined directly in the code, making it harder to tweak the glow look consistently.

💡 Extract them into named constants (e.g. GLOW_ALPHA, CORE_BRIGHTNESS) near the top of the file so the visual style can be tuned in one place.

🔄 Code Flow

Code flow showing setup, initspiroparams, draw, windowresized

💡 Click on function names in the diagram to jump to their code

graph TD start[Start] --> setup[setup] setup --> initspiroparams[initspiroparams] setup --> draw[draw loop] draw --> start-position[start-position] draw --> step-loop[step-loop] step-loop --> hypotrochoid-math[hypotrochoid-math] hypotrochoid-math --> glow-stroke[glow-stroke] glow-stroke --> draw draw --> windowresized[windowresized] click setup href "#fn-setup" click initspiroparams href "#fn-initspiroparams" click draw href "#fn-draw" click start-position href "#sub-start-position" click step-loop href "#sub-step-loop" click hypotrochoid-math href "#sub-hypotrochoid-math" click glow-stroke href "#sub-glow-stroke" click windowresized href "#fn-windowresized" step-loop -->|Loop| step-loop glow-stroke -->|Conditional| draw

❓ Frequently Asked Questions

What visual effects can I expect from the Rainbow Spirograph sketch?

The sketch creates mesmerizing animated spirographs with intricate geometric patterns using a colorful, glowing line against a dark background.

Is there any way for users to interact with the Rainbow Spirograph sketch?

The sketch is primarily a visual experience without interactivity, but users can adjust their browser window size to see how the spirograph adapts to different dimensions.

What creative coding concepts are showcased in the Rainbow Spirograph sketch?

This sketch demonstrates the hypotrochoid algorithm for generating complex curves and employs techniques like off-screen graphics buffering to create smooth, layered animations.

Preview

Rainbow Spirograph - xelsed.ai - p5.js creative coding sketch preview
Sketch Preview
Code flow diagram showing the structure of Rainbow Spirograph - xelsed.ai - Code flow showing setup, initspiroparams, draw, windowresized
Code Flow Diagram