Shape dance

This sketch creates an interactive audio visualization where three types of shapes dance and react to different frequencies of sound from your microphone. A pulsating ellipse responds to bass, rotating rectangles follow mid-range energy, and a waveform spectrum analyzer at the bottom visualizes the full frequency spectrum.

🧪 Try This!

Experiment with the code by making these changes:

  1. Change the ellipse color — The pink ellipse will turn into a different color, demonstrating how RGB values control color appearance
  2. Make the rectangles spin faster — The rotation angle will increment more rapidly, making the rectangle animation match the mid-range frequencies more dramatically
  3. Enlarge the center ellipse — The bass-reactive ellipse will grow much larger on every beat, creating a more dramatic visual impact
  4. Use mid-range to control ellipse size instead — The center ellipse will now pulse with vocals and guitars instead of bass, creating a completely different visual feel
  5. Make the spectrum waveform taller — The waveform at the bottom will extend higher up the screen, showing greater visual detail and intensity
Prefer the full editor? Open it there →

📖 About This Sketch

This sketch transforms sound into motion by analyzing your microphone's audio in real time using Fast Fourier Transform (FFT) analysis. Three distinct visual elements dance independently: a pulsating ellipse in the center driven by bass frequencies, rotating rectangles that spin with mid-range energy, and a colorful waveform spectrum analyzer at the bottom that displays the entire frequency spectrum. The result is a mesmerizing light show that reacts instantly to music, speech, or any sound around you.

The code is organized around the p5.sound library's FFT analyzer, which breaks audio into three energy bands (bass, mid, treble) that each drive different visual behaviors. You will learn how to initialize the microphone, analyze frequencies in real time, use the map() function to convert audio energy into visual parameters like size and rotation, and combine multiple layered shapes to create a complex, dynamic visualization.

⚙️ How It Works

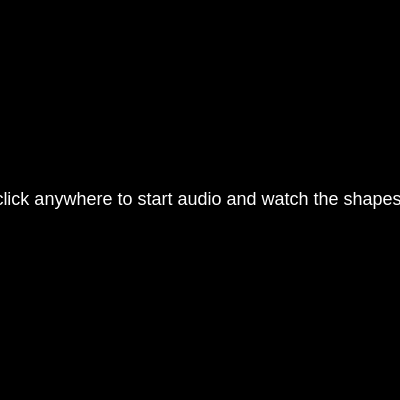
  1. When the sketch loads, setup() creates a full-window canvas and initializes a microphone input and FFT analyzer, but does not yet start listening (for mobile compatibility). An instruction message appears telling the user to tap or click.
  2. When the user taps or clicks anywhere, startAudio() resumes the audio context, activates the microphone, and sets audioStarted to true, allowing the visualization to begin.
  3. Every frame, draw() analyzes the current audio using fft.analyze() and extracts three energy values: bassEnergy, midEnergy, and trebleEnergy, each ranging from 0-255.
  4. These energy values are mapped using map() into visual parameters: bassEnergy controls the size and opacity of the central pulsating ellipse, midEnergy controls the rotation angle of the rectangles, and trebleEnergy controls the color of the spectrum waveform.
  5. A pulsating ellipse and inner circle are drawn at the canvas center with opacity driven by bass energy, creating a breathing effect that pulses with the beat.
  6. Two rotating rectangles are drawn inside a push/pop block that translates and rotates the entire coordinate system based on mid-range energy, so they spin independently of the ellipse.
  7. Finally, the full frequency spectrum (1024 frequency bins) is drawn as a waveform graph at the bottom of the screen, with each frequency bin's amplitude plotted as a vertex, creating a bouncing waveform visualization.

🎓 Concepts You'll Learn

Audio input and microphone accessFFT (Fast Fourier Transform) frequency analysisEnergy band extraction (bass, mid, treble)Real-time data mapping with map()Coordinate transformations (translate, rotate, push/pop)Dynamic color and opacity based on audioWaveform visualization from spectrum data

📝 Code Breakdown

setup()

setup() runs once when the sketch starts. It is where you initialize your canvas, audio system, and draw any static instructions. Notice that mic.start() is NOT called here - it waits for user interaction (a click or tap) because modern browsers require user gesture to access the microphone for security reasons.

function setup() {
  createCanvas(windowWidth, windowHeight);
  // Tip: Use windowWidth/windowHeight for responsive canvas

  // Initialize audio input and FFT analyzer
  mic = new p5.AudioIn(); // Create an audio input object
  // mic.start() is called later on user gesture for mobile compatibility

  fft = new p5.FFT(); // Create an FFT analyzer
  fft.setInput(mic); // Connect the FFT analyzer to the microphone input

  // Set up text for instructions
  textAlign(CENTER, CENTER); // Align text to the center
  textSize(18); // Set font size
  fill(255); // Set text color to white
  noStroke(); // No border for the text

  // Initially draw the instruction message
  background(0); // Black background
  text("Tap or click anywhere to start audio and watch the shapes dance!", width / 2, height / 2);
}
Line-by-line explanation (6 lines)

🔧 Subcomponents:

calculation Canvas Initialization createCanvas(windowWidth, windowHeight);

Creates a canvas that fills the entire browser window and responds to resizing

calculation Audio System Setup mic = new p5.AudioIn(); fft = new p5.FFT(); fft.setInput(mic);

Initializes the microphone input and FFT analyzer, then connects them so the analyzer can examine the microphone audio

calculation Text Styling textAlign(CENTER, CENTER); textSize(18); fill(255); noStroke();

Configures text to be centered and white before drawing the instruction message

createCanvas(windowWidth, windowHeight);
Creates a canvas that spans the full width and height of the browser window, making the visualization fullscreen and responsive
mic = new p5.AudioIn();
Creates a new microphone input object that will capture audio from your device - mic.start() is delayed until the user clicks for mobile compatibility
fft = new p5.FFT();
Creates a Fast Fourier Transform analyzer object that will break the audio signal into frequency bands we can analyze
fft.setInput(mic);
Tells the FFT analyzer to analyze the microphone's audio stream instead of the default speakers
textAlign(CENTER, CENTER);
Sets text alignment so the text() function centers its output at the x,y coordinates you provide
text("Tap or click anywhere to start audio and watch the shapes dance!", width / 2, height / 2);
Draws the instruction message centered on the canvas at the middle point (width/2, height/2)
draw()

draw() is called 60 times per second, making this the heart of the animation. Each frame it analyzes fresh audio data, extracts energy values, maps them to visual parameters, and draws the three reactionary shapes. The early return when audioStarted is false prevents errors and keeps the instruction text visible until the user interacts.

🔬 These three lines extract energy from different parts of the frequency spectrum. What happens if you swap them - move the 'bass' line to the middle, the 'mid' line to the bottom, and the 'treble' line to the top? Which frequency will now control the ellipse size?

  let bassEnergy = fft.getEnergy("bass"); // Low frequencies (e.g., kick drums, bass lines)
  let midEnergy = fft.getEnergy("mid");   // Mid-range frequencies (e.g., vocals, guitars)
  let trebleEnergy = fft.getEnergy("treble"); // High frequencies (e.g., cymbals, high hats)
function draw() {
  if (!audioStarted) {
    // If audio hasn't started yet, we don't perform any audio analysis or visualization.
    // The instruction message drawn in setup() remains on screen.
    return; // Exit the draw loop early
  }

  background(0); // Black background for contrast

  // Analyze the audio spectrum using the FFT analyzer
  fft.analyze();

  // Get energy levels for different frequency bands
  // These values range from 0-255, representing the amplitude (loudness)
  // of frequencies in that band.
  let bassEnergy = fft.getEnergy("bass"); // Low frequencies (e.g., kick drums, bass lines)
  let midEnergy = fft.getEnergy("mid");   // Mid-range frequencies (e.g., vocals, guitars)
  let trebleEnergy = fft.getEnergy("treble"); // High frequencies (e.g., cymbals, high hats)

  // Map energy levels to visual parameters
  // The map() function converts a value from one range (0-255) to another
  // (e.g., a size range, an angle range, or a color brightness range).
  let ellipseSize = map(bassEnergy, 0, 255, width * 0.1, width * 0.4);
  let rotationAngle = map(midEnergy, 0, 255, 0, TWO_PI); // Rotate from 0 to 360 degrees
  let lineColor = map(trebleEnergy, 0, 255, 100, 255); // Color brightness based on treble

  // --- Central Pulsating Ellipse (Reacts to Bass) ---
  noStroke(); // No border for the ellipse
  // Fill color is pinkish, with opacity driven by bass energy.
  // Higher bass means more opaque (stronger presence), creating a pulsing effect.
  fill(255, 0, 150, bassEnergy);
  ellipse(width / 2, height / 2, ellipseSize, ellipseSize);

  // Add a subtle inner ellipse for more visual interest
  fill(150, 0, 255, bassEnergy / 2); // Purplish, more transparent
  ellipse(width / 2, height / 2, ellipseSize * 0.7, ellipseSize * 0.7);

  // --- Rotating Rectangles (Reacts to Mid-range) ---
  push(); // Save the current drawing state (translation, rotation, etc.)
  translate(width / 2, height / 2); // Move the origin (0,0) to the center of the canvas
  rotate(rotationAngle); // Rotate the canvas based on mid-range energy
  rectMode(CENTER); // Draw rectangles from their center point

  stroke(255, midEnergy, 0, midEnergy); // Orangish stroke, opacity based on mid-range energy
  noFill(); // No fill for the rectangles
  strokeWeight(2); // Set stroke thickness
  rect(0, 0, width * 0.3, width * 0.3); // Outer rectangle

  stroke(255, midEnergy, 0, midEnergy / 2); // More transparent stroke for the inner rectangle
  rect(0, 0, width * 0.25, width * 0.25); // Inner rectangle

  pop(); // Restore the drawing state (undo translate and rotate)

  // --- Spectrum Analyzer at the bottom (Reacts to Treble/Overall Frequencies) ---
  // fft.spectrum() returns an array of 1024 amplitude values (0-255)
  // across the entire frequency range.
  let spectrum = fft.spectrum();

  noFill(); // No fill for the spectrum shape
  // Stroke color varies with treble energy, creating a dynamic visual effect.
  stroke(lineColor, trebleEnergy, 255 - trebleEnergy);
  strokeWeight(1); // Set stroke thickness
  beginShape(); // Start drawing a custom shape (a series of connected vertices)
  vertex(0, height); // Start drawing from the bottom-left corner
  for (let i = 0; i < spectrum.length; i++) {
    // Map each frequency bin to an x-position across the canvas width
    let x = map(i, 0, spectrum.length, 0, width);
    // Map each amplitude value to a y-position, creating a waveform-like graph
    let y = map(spectrum[i], 0, 255, height, height * 0.6); // Spectrum goes from bottom to 60% up
    vertex(x, y); // Add a point to the shape
  }
  vertex(width, height); // End drawing at the bottom-right corner
  endShape(); // Complete the shape
}
Line-by-line explanation (29 lines)

🔧 Subcomponents:

conditional Audio Started Check if (!audioStarted) { return; }

Exits the draw loop early if audio has not started, preventing errors and keeping the instruction message on screen

calculation FFT Audio Analysis fft.analyze(); let bassEnergy = fft.getEnergy("bass"); let midEnergy = fft.getEnergy("mid"); let trebleEnergy = fft.getEnergy("treble");

Analyzes the microphone audio and extracts energy levels for three frequency bands that will control different visual elements

calculation Energy to Visual Mapping let ellipseSize = map(bassEnergy, 0, 255, width * 0.1, width * 0.4); let rotationAngle = map(midEnergy, 0, 255, 0, TWO_PI); let lineColor = map(trebleEnergy, 0, 255, 100, 255);

Converts the 0-255 energy values into useful visual parameters: sizes, angles, and brightness levels

calculation Central Pulsating Ellipse fill(255, 0, 150, bassEnergy); ellipse(width / 2, height / 2, ellipseSize, ellipseSize); fill(150, 0, 255, bassEnergy / 2); ellipse(width / 2, height / 2, ellipseSize * 0.7, ellipseSize * 0.7);

Draws two nested ellipses at the canvas center, both pulsating with opacity driven by bass energy

calculation Rotating Rectangles push(); translate(width / 2, height / 2); rotate(rotationAngle); rectMode(CENTER); stroke(255, midEnergy, 0, midEnergy); noFill(); strokeWeight(2); rect(0, 0, width * 0.3, width * 0.3); stroke(255, midEnergy, 0, midEnergy / 2); rect(0, 0, width * 0.25, width * 0.25); pop();

Draws two outlined rectangles that rotate based on mid-range energy, using push/pop to isolate transformations

for-loop Spectrum Waveform Loop for (let i = 0; i < spectrum.length; i++) { let x = map(i, 0, spectrum.length, 0, width); let y = map(spectrum[i], 0, 255, height, height * 0.6); vertex(x, y); }

Loops through all 1024 frequency bins and converts each into a vertex that forms the waveform shape at the bottom

if (!audioStarted) {
Checks if the audioStarted flag is still false (audio hasn't started yet)
return; // Exit the draw loop early
If audio hasn't started, this command immediately exits draw() without running any visualization code, preserving the instruction message on screen
background(0); // Black background for contrast
Clears the canvas to black at the start of each frame, erasing the previous frame's shapes
fft.analyze();
Analyzes the current microphone audio and updates the FFT's internal frequency data, making it ready to query
let bassEnergy = fft.getEnergy("bass");
Extracts the energy (amplitude) in the bass frequencies (0-20Hz typically), returning a value from 0-255
let midEnergy = fft.getEnergy("mid");
Extracts the energy in the mid-range frequencies (typically ~200-2000Hz)
let trebleEnergy = fft.getEnergy("treble");
Extracts the energy in the high frequencies (typically ~2000Hz and up)
let ellipseSize = map(bassEnergy, 0, 255, width * 0.1, width * 0.4);
Converts bassEnergy (0-255) into a size range: when there's no bass it's width*0.1 (small), when there's loud bass it's width*0.4 (large)
let rotationAngle = map(midEnergy, 0, 255, 0, TWO_PI);
Converts midEnergy into a rotation angle from 0 to 360 degrees (TWO_PI radians) - more mid-range energy spins the rectangles faster
let lineColor = map(trebleEnergy, 0, 255, 100, 255);
Converts trebleEnergy into a color brightness value from 100-255, controlling how bright the spectrum waveform appears
fill(255, 0, 150, bassEnergy);
Sets the fill color to pinkish (red=255, green=0, blue=150) with opacity (alpha) equal to bassEnergy - more bass makes it more opaque
ellipse(width / 2, height / 2, ellipseSize, ellipseSize);
Draws a circle at the canvas center (width/2, height/2) with diameter equal to ellipseSize, which grows and shrinks with bass
push();
Saves the current drawing state (position, rotation, colors, etc.) so changes only affect code until pop()
translate(width / 2, height / 2);
Moves the origin point (0,0) to the center of the canvas, so subsequent rotations will pivot around the center
rotate(rotationAngle);
Rotates the entire canvas by rotationAngle radians, which changes every frame based on mid-range energy
rectMode(CENTER);
Changes how rectangles are drawn so they pivot from their center point (0,0) instead of from their corner
stroke(255, midEnergy, 0, midEnergy);
Sets the outline color to orange-ish (red=255, green=midEnergy, blue=0) with opacity equal to midEnergy
rect(0, 0, width * 0.3, width * 0.3);
Draws an outlined rectangle at the canvas center (now at 0,0 due to translate) with width and height of 30% the canvas width
pop();
Restores the drawing state, undoing the translate and rotate so the rest of the sketch draws normally
let spectrum = fft.spectrum();
Gets an array of 1024 frequency amplitude values (0-255 each), one for each frequency band in the audio
stroke(lineColor, trebleEnergy, 255 - trebleEnergy);
Sets the waveform outline color to a color that changes with treble energy - bright cyan when treble is high, dim when it's low
beginShape();
Starts recording a series of vertex() points that will form a custom connected shape when endShape() is called
vertex(0, height);
Adds the first point at the bottom-left corner of the canvas, starting the waveform from the bottom
for (let i = 0; i < spectrum.length; i++) {
Loops through all 1024 frequency bins in the spectrum array
let x = map(i, 0, spectrum.length, 0, width);
Converts the frequency bin index (0-1024) into an x-position (0 to canvas width), spreading the spectrum across horizontally
let y = map(spectrum[i], 0, 255, height, height * 0.6);
Converts each frequency's amplitude (0-255) into a y-position - silent frequencies stay at the bottom, loud frequencies go up 40% of the canvas height
vertex(x, y);
Adds a point to the shape at (x, y), which will be connected to adjacent vertices when endShape() is called
vertex(width, height);
Adds the final point at the bottom-right corner to close the waveform shape
endShape();
Completes the shape by connecting all the vertices together, drawing the waveform outline on screen

windowResized()

windowResized() is a special p5.js function that automatically runs whenever the browser window is resized. By calling resizeCanvas() here, we ensure the visualization scales smoothly to any window size. The instruction redraw only happens if audio hasn't started, keeping the interface responsive during window manipulation.

function windowResized() {
  resizeCanvas(windowWidth, windowHeight);
  // Re-draw instructions if audio hasn't started yet
  if (!audioStarted) {
    background(0); // Clear the canvas
    textAlign(CENTER, CENTER);
    textSize(20);
    fill(255);
    noStroke();
    text("Tap or click anywhere to start audio and watch the shapes dance!", width / 2, height / 2);
  }
}
Line-by-line explanation (4 lines)

🔧 Subcomponents:

calculation Canvas Resize resizeCanvas(windowWidth, windowHeight);

Updates the canvas dimensions when the browser window is resized

conditional Redraw Instructions if Needed if (!audioStarted) { background(0); textAlign(CENTER, CENTER); textSize(20); fill(255); noStroke(); text("Tap or click anywhere to start audio and watch the shapes dance!", width / 2, height / 2); }

If the user resizes the window before starting audio, this redraws the instruction message centered in the new canvas size

resizeCanvas(windowWidth, windowHeight);
Updates the canvas to match the new browser window dimensions when the user resizes their window
if (!audioStarted) {
Checks if audio has not yet started - if so, redraw instructions on the new canvas size
background(0);
Clears the canvas to black to prepare for redrawing the instruction text
text("Tap or click anywhere to start audio and watch the shapes dance!", width / 2, height / 2);
Redraws the instruction message centered on the newly resized canvas

startAudio()

startAudio() is the gatekeeper that initializes microphone access. It is called only after the user clicks or taps (see mousePressed() and touchStarted() below), satisfying browser security requirements. The audio context check prevents errors if startAudio() is accidentally called multiple times.

function startAudio() {
  if (getAudioContext().state !== 'running') {
    getAudioContext().resume(); // Resume the audio context
    mic.start(); // Start the microphone input
    audioStarted = true; // Set flag to true
  }
}
Line-by-line explanation (4 lines)

🔧 Subcomponents:

conditional Audio Context State Check if (getAudioContext().state !== 'running') {

Checks if the audio context is not already running before attempting to start it, preventing duplicate starts

if (getAudioContext().state !== 'running') {
Gets the Web Audio API context and checks its state - if it's not 'running', we proceed to start it (modern browsers require this)
getAudioContext().resume();
Resumes the audio context, which many modern browsers require to be explicitly resumed by user gesture for security reasons
mic.start();
Starts the microphone input stream - the browser will ask the user for permission to use their microphone
audioStarted = true;
Sets the audioStarted flag to true, allowing draw() to proceed with audio analysis and visualization

mousePressed()

mousePressed() is a special p5.js function that automatically runs when the user clicks the mouse. By calling startAudio() here, we satisfy browser security policies that require user gesture before accessing the microphone.

function mousePressed() {
  startAudio();
}
Line-by-line explanation (1 lines)
startAudio();
Calls the startAudio() function when the user clicks anywhere on the canvas, triggering microphone access

touchStarted()

touchStarted() is a special p5.js function that runs when the user touches the screen on a mobile or tablet device. This ensures the sketch works on phones and tablets, not just desktop computers with a mouse. Returning false prevents default browser behaviors that would otherwise interfere.

function touchStarted() {
  startAudio();
  // Prevent default touch behavior (e.g., scrolling)
  return false;
}
Line-by-line explanation (2 lines)
startAudio();
Calls the startAudio() function when the user touches the screen (for mobile devices)
return false;
Prevents the browser's default touch behavior (like scrolling) from interfering with the sketch, keeping the visualization uninterrupted

📦 Key Variables

mic p5.AudioIn object

Stores the microphone input object that captures audio from your device's microphone

let mic;
fft p5.FFT object

Stores the Fast Fourier Transform analyzer that breaks audio into frequency bands (bass, mid, treble) and provides the full spectrum

let fft;
audioStarted boolean

A flag (true/false) that tracks whether the user has clicked to start the microphone - false keeps the instruction message on screen, true starts the visualization

let audioStarted = false;
bassEnergy number

Stores the current energy level (0-255) of low frequencies detected by the FFT analyzer - used to control ellipse size and pulsing

let bassEnergy = fft.getEnergy("bass");
midEnergy number

Stores the current energy level (0-255) of mid-range frequencies - used to control rectangle rotation speed and color opacity

let midEnergy = fft.getEnergy("mid");
trebleEnergy number

Stores the current energy level (0-255) of high frequencies - used to control spectrum waveform color brightness

let trebleEnergy = fft.getEnergy("treble");
ellipseSize number

Stores the calculated diameter of the pulsating ellipse, mapped from bassEnergy (ranges from 10% to 40% of canvas width)

let ellipseSize = map(bassEnergy, 0, 255, width * 0.1, width * 0.4);
rotationAngle number

Stores the calculated rotation angle for the rectangles in radians, mapped from midEnergy (ranges from 0 to 360 degrees)

let rotationAngle = map(midEnergy, 0, 255, 0, TWO_PI);
lineColor number

Stores the calculated brightness value for the spectrum waveform outline, mapped from trebleEnergy (ranges from 100-255)

let lineColor = map(trebleEnergy, 0, 255, 100, 255);
spectrum array

Stores an array of 1024 frequency amplitude values (0-255 each), with one value per frequency bin across the audio spectrum

let spectrum = fft.spectrum();

🔧 Potential Improvements (5)

Here are some ways this code could be enhanced:

BUG draw() audio guard

If draw() returns early due to audioStarted being false, the black background is never drawn, so the instruction text persists indefinitely until audio starts

💡 Add `background(0);` before the audioStarted check to ensure a clean black background is maintained at all times, even while waiting for user input

PERFORMANCE draw() spectrum loop

The loop runs 1024 times per frame at 60 FPS, which is 61,440 vertex calls per second - this is computationally expensive on slower devices

💡 Optimize by drawing every nth vertex: change `i++` to `i += 2` or `i += 4`, reducing the number of points while maintaining visual quality. Mobile devices will see significant performance improvements.

STYLE setup() and windowResized()

The instruction text is duplicated in two places (setup and windowResized), violating the DRY principle

💡 Create a helper function `function drawInstructions() { ... }` and call it from both places to avoid code duplication and make future text changes easier

FEATURE startAudio()

Once audio starts, there is no visual feedback that the microphone is active or any indication to the user that they should start making sound

💡 Add text display in draw() that shows the current bassEnergy/midEnergy/trebleEnergy values or a simple 'Microphone Active' message to confirm the system is working

BUG draw() rotating rectangles

If the canvas width is not square, the rectangles become distorted because they use `width * 0.3` for both width and height, which will be asymmetrical on non-square canvases

💡 Use `min(width, height) * 0.3` instead of just `width * 0.3` to ensure square rectangles regardless of canvas aspect ratio

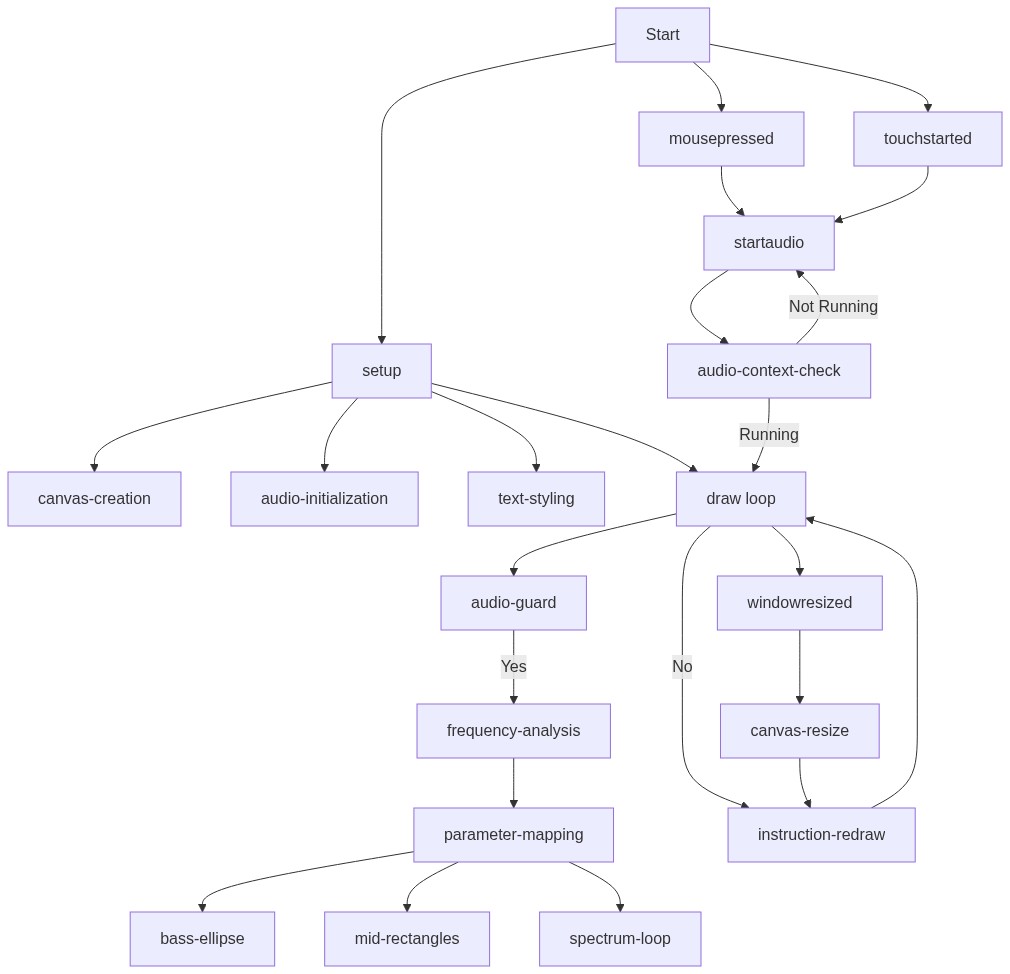
🔄 Code Flow

Code flow showing setup, draw, windowresized, startaudio, mousepressed, touchstarted

💡 Click on function names in the diagram to jump to their code

graph TD start[Start] --> setup[setup] setup --> canvas-creation[Canvas Initialization] setup --> audio-setup[Audio System Setup] setup --> text-styling[Text Styling] setup --> draw[draw loop] click setup href "#fn-setup" click canvas-creation href "#sub-canvas-creation" click audio-setup href "#sub-audio-setup" click text-styling href "#sub-text-styling" draw --> audio-guard[Audio Started Check] audio-guard -->|false| draw audio-guard -->|true| fft-analysis[FFT Audio Analysis] fft-analysis --> data-mapping[Energy to Visual Mapping] data-mapping --> center-ellipse[Central Pulsating Ellipse] data-mapping --> rotating-rectangles[Rotating Rectangles] rotating-rectangles --> spectrum-loop[Spectrum Waveform Loop] spectrum-loop --> draw click draw href "#fn-draw" click audio-guard href "#sub-audio-guard" click fft-analysis href "#sub-fft-analysis" click data-mapping href "#sub-data-mapping" click center-ellipse href "#sub-center-ellipse" click rotating-rectangles href "#sub-rotating-rectangles" click spectrum-loop href "#sub-spectrum-loop" windowresized --> canvas-resize[Canvas Resize] canvas-resize --> instruction-redraw[Redraw Instructions if Needed] click windowresized href "#fn-windowresized" click canvas-resize href "#sub-canvas-resize" click instruction-redraw href "#sub-instruction-redraw" mousepressed --> startaudio[Start Audio] startaudio --> audio-context-check[Audio Context State Check] audio-context-check -->|not running| audio-setup audio-context-check -->|already running| draw click mousepressed href "#fn-mousepressed" click startaudio href "#fn-startaudio" click audio-context-check href "#sub-audio-context-check" touchstarted --> startaudio click touchstarted href "#fn-touchstarted"

❓ Frequently Asked Questions

What visual experience does the Shape Dance sketch provide?

The Shape Dance sketch features animated shapes that move around the screen, responding to audio input in an engaging and dynamic visual display.

How can users interact with the Shape Dance sketch?

Users can interact by tapping or clicking anywhere on the canvas to start the audio input, which activates the shape animations.

What creative coding concept does the Shape Dance sketch illustrate?

This sketch demonstrates the use of audio analysis through Fast Fourier Transform (FFT) to create visualizations that react to sound frequencies.

Preview

Shape dance - p5.js creative coding sketch preview
Sketch Preview
Code flow diagram showing the structure of Shape dance - Code flow showing setup, draw, windowresized, startaudio, mousepressed, touchstarted
Code Flow Diagram