
Sketch 2026-02-16 07:50

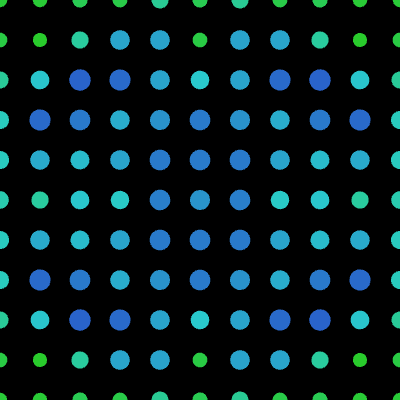
This interactive sketch creates a dynamic grid of circles that responds to mouse/touch movement and device orientation. The oscillator's pitch and volume follow your cursor, while Perlin noise generates flowing patterns that pulse with the sound's amplitude, blending audio and visuals into a unified experience.

🧪 Try This!

Experiment with the code by making these changes:

  1. Reverse the pitch control — Swap the frequency range so moving left goes high and right goes low, inverting the intuitive direction
  2. Invert the volume control — Move the amplitude mapping so top of screen is silent and bottom is loud—opposite of the default behavior
  3. Speed up the pattern animation — Increase how fast the Perlin noise evolves over time, making the grid pulse and flow much quicker
  4. Make circles more muted in color — Lower the saturation value so colors appear more grayish and less vivid, creating a softer mood
  5. Increase the grid's minimum size range — Expand how large circles can grow relative to spacing, filling more of the canvas with shapes
  6. Switch to a square wave — Change the oscillator's waveform from smooth sine to harsh square, drastically altering the audio timbre
Prefer the full editor? Open it there →

📖 About This Sketch

This sketch merges sound and visuals into a single interactive experience. Move your mouse left-right to sweep the oscillator's frequency from low to high, and up-down to control volume and grid density. Tilt your device (if it has an accelerometer) to rotate the entire pattern in 3D space. The grid itself is generated using Perlin noise—a technique that creates smooth, organic flow rather than random chaos—and each circle's brightness pulses in sync with the sound's amplitude.

The code is organized around three core ideas: audio synthesis (using p5.sound's oscillator and amplitude measurement), generative visuals (nested loops with Perlin noise), and interaction (mapping user input to both sound parameters and visual properties). By studying it, you will learn how to connect real-time sensor data to sound frequency, how color mode (HSB) can create more expressive palettes than RGB, and how Perlin noise adds organic life to procedural grids.

⚙️ How It Works

  1. When the sketch loads, setup() creates a WEBGL canvas with ortho() projection, initializes a sine wave oscillator (starting silent), and prepares an amplitude meter to track the sound level.
  2. Every frame, draw() reads the mouse or touch position and maps it: horizontal movement controls the oscillator frequency (left=100Hz, right=1000Hz), and vertical movement controls both amplitude (up=loud, down=silent) and grid density (up=50 circles per row, down=10).
  3. Device orientation sensors (rotationX and rotationY) rotate the entire scene in 3D space if the device supports them and the browser grants permission.
  4. The sketch switches to HSB color mode and loops through a grid of positions, calculating a unique Perlin noise value for each point—this noise value determines the circle's size, hue, and also feeds the animation (frameCount is included in the noise calculation so the pattern flows over time).
  5. Circle brightness is modulated by the oscillator's amplitude: louder sound = brighter shapes, creating a visual pulse that synchronizes with the audio.
  6. Text color switches back to RGB and displays debug info (commented out by default), then the loop repeats 60 times per second.

🎓 Concepts You'll Learn

Audio synthesis with oscillatorsReal-time audio amplitude measurementPerlin noise for organic patternsHSB color mode (Hue, Saturation, Brightness)Device sensor integration (accelerometer/gyroscope)WEBGL and 3D transformationsNested loops for grid generationInput mapping and interaction design

📝 Code Breakdown

setup()

setup() runs once when the sketch starts. WEBGL mode enables device sensors (rotationX, rotationY) and 3D transformations; ortho() projects 3D space onto a 2D canvas centered at the origin. The p5.sound library (osc and amp) must be initialized here before draw() references them.

function setup() {
  // Create a canvas that fills the window, using WEBGL for potential 3D features
  createCanvas(windowWidth, windowHeight, WEBGL);
  
  // Switch to orthographic (2D) projection within the WEBGL context
  // This makes drawing 2D shapes like circle() behave more predictably
  ortho(); 
  
  noStroke(); // No outlines for the shapes

  // Initialize a sine wave oscillator
  osc = new p5.Oscillator('sine');
  osc.amp(0); // Start with 0 amplitude (silent)
  osc.start(); // Start the oscillator, but it won't be heard until amplitude increases

  // Initialize an amplitude object to measure the oscillator's sound level
  amp = new p5.Amplitude();
}
Line-by-line explanation (7 lines)

🔧 Subcomponents:

function-call Canvas and WEBGL setup createCanvas(windowWidth, windowHeight, WEBGL);

Creates a canvas that fills the window and enables WEBGL mode for 3D capabilities and device sensor access

object-instantiation Oscillator initialization osc = new p5.Oscillator('sine');

Creates a sine wave oscillator that will generate sound when amplitude is increased

object-instantiation Amplitude meter setup amp = new p5.Amplitude();

Creates an object that measures the oscillator's real-time sound level for visual feedback

createCanvas(windowWidth, windowHeight, WEBGL);
Creates a WEBGL canvas (not the default 2D) that fills the entire browser window; WEBGL enables 3D rotations and better sensor integration
ortho();
Switches from perspective 3D projection to orthographic (2D-like) projection; this centers (0,0) at the canvas middle and makes circle() behave predictably
noStroke();
Disables outlines on all shapes so only the fill color is visible
osc = new p5.Oscillator('sine');
Creates a new oscillator object that generates a smooth sine wave; the argument 'sine' specifies the wave shape (other options: 'square', 'triangle', 'sawtooth')
osc.amp(0);
Sets the oscillator's amplitude (volume) to 0, so it produces no audible sound initially
osc.start();
Starts the oscillator; it begins producing audio signal, but remains silent because amplitude is 0
amp = new p5.Amplitude();
Creates an amplitude meter that continuously samples the oscillator's output and tracks its volume level
draw()

draw() runs 60 times per second. This is where the interaction loop happens: read input, update audio synthesis, calculate visuals, and render. The nested for-loops are the heart of generative art—they iterate through a parameter space (a grid) and use deterministic functions (noise, map) to produce variation. Perlin noise is key: unlike random(), which jumps chaotically, noise() produces smooth, correlated values that create organic flow. The audio-visual sync (brightness responding to amp.getLevel()) is what makes the experience unified—the viewer feels sound *and* sees it pulsing.

🔬 This snippet uses Perlin noise to vary circle sizes. What happens if you change frameCount * 0.005 to frameCount * 0.02? To frameCount * 0.001? How does the animation speed change?

      let n = noise(x * 0.01, y * 0.01, frameCount * 0.005);

      // Modulate circle size based on noise value and density
      let circleSize = map(n, 0, 1, 5, spacing * 0.8);

🔬 These lines map horizontal mouse position to pitch. What happens if you swap the 100 and 1000 to map(currentX, 0, width, 1000, 100)? How will the pitch control direction change?

  // Map X position to oscillator frequency
  // As you move left to right, the pitch changes from low to high
  frequency = map(currentX, 0, width, 100, 1000);
  osc.freq(frequency); // Set oscillator frequency
function draw() {
  background(0); // Black background

  // --- Interaction ---
  // Determine current X and Y positions from touch or mouse
  // Use touches.length > 0 as a robust check for touch interaction
  let currentX = touches.length > 0 ? touchX : mouseX;
  let currentY = touches.length > 0 ? touchY : mouseY;

  // Map X position to oscillator frequency
  // As you move left to right, the pitch changes from low to high
  frequency = map(currentX, 0, width, 100, 1000);
  osc.freq(frequency); // Set oscillator frequency

  // Map Y position to oscillator amplitude (volume)
  // Moving up increases amplitude, moving down decreases it (silent at bottom)
  let amplitudeLevel = map(currentY, 0, height, 0.5, 0);
  osc.amp(amplitudeLevel, 0.1); // Fade amplitude over 0.1 seconds for smooth change

  // Map Y position to visual density
  // Moving up increases the number of shapes in the grid
  density = map(currentY, 0, height, 10, 50);

  // --- Sensor Input (Device Orientation) ---
  // rotationX and rotationY are p5.js global variables that
  // provide device orientation data (pitch and roll).
  // These will only work on devices with accelerometers/gyroscopes
  // and if the browser grants access.
  rotateX(radians(rotationX)); // Rotate the whole scene based on device's X-axis tilt
  rotateY(radians(rotationY)); // Rotate the whole scene based on device's Y-axis tilt

  // --- Generative Visual Pattern ---
  // Set color mode to HSB (Hue, Saturation, Brightness) for vibrant colors
  colorMode(HSB); 

  // Calculate spacing for the grid based on current density
  let spacing = width / density;

  // Loop through a grid to draw circles
  // In WEBGL mode with ortho(), (0,0) is at the center of the canvas
  // So we iterate from -width/2 to width/2 and -height/2 to height/2
  for (let x = -width / 2; x <= width / 2; x += spacing) {
    for (let y = -height / 2; y <= height / 2; y += spacing) {
      // Calculate a Perlin noise value for each position
      // Perlin noise creates natural-looking, flowing patterns
      let n = noise(x * 0.01, y * 0.01, frameCount * 0.005);

      // Modulate circle size based on noise value and density
      let circleSize = map(n, 0, 1, 5, spacing * 0.8);

      // Modulate hue (color) based on noise value
      let hue = map(n, 0, 1, 0, 360);

      // Modulate brightness based on the current audio amplitude
      // As the sound gets louder, the shapes get brighter
      let brightness = map(amp.getLevel(), 0, 0.5, 50, 100); 

      // Set fill color and draw the circle
      fill(hue, 80, brightness);
      circle(x, y, circleSize); // [p5.js Reference: circle()](https://p5js.org/reference/p5/circle/)
    }
  }

  // --- Display Info (Optional) ---
  // Switch back to RGB color mode for text
  colorMode(RGB); 
  fill(255); // White text
  textSize(16);
  textAlign(LEFT, TOP);
  // Uncomment these lines to see the live values for debugging:
  // text(`Frequency: ${frequency.toFixed(2)} Hz`, -width/2 + 10, -height/2 + 10);
  // text(`Amplitude: ${amp.getLevel().toFixed(2)}`, -width/2 + 10, -height/2 + 30);
  // text(`RotationX: ${rotationX.toFixed(2)}`, -width/2 + 10, -height/2 + 50);
  // text(`RotationY: ${rotationY.toFixed(2)}`, -width/2 + 10, -height/2 + 70);
}
Line-by-line explanation (21 lines)

🔧 Subcomponents:

calculation Input-to-Sound Mapping frequency = map(currentX, 0, width, 100, 1000); osc.freq(frequency);

Converts mouse/touch X position into an oscillator frequency, creating a pitch range controllable by left-right cursor movement

calculation Y Position to Volume let amplitudeLevel = map(currentY, 0, height, 0.5, 0); osc.amp(amplitudeLevel, 0.1);

Maps vertical position to sound volume and applies smooth fading (0.1 second transition) to prevent audio clicks

for-loop Nested Grid Generation for (let x = -width / 2; x <= width / 2; x += spacing) { for (let y = -height / 2; y <= height / 2; y += spacing) {

Iterates through a 2D grid of points, with spacing determined by density, to draw circles at each position

calculation Perlin Noise Sampling let n = noise(x * 0.01, y * 0.01, frameCount * 0.005);

Calculates a smooth, organic noise value for each grid point; x and y are scaled down and frameCount adds time dimension for animation

calculation Brightness to Audio Amplitude let brightness = map(amp.getLevel(), 0, 0.5, 50, 100);

Links circle brightness directly to the oscillator's current sound level, creating visual pulse synchronized with audio

background(0);
Fills the entire canvas with black (RGB value 0) at the start of every frame, erasing the previous frame to avoid trails
let currentX = touches.length > 0 ? touchX : mouseX;
Checks if any touch is active; if yes, uses touchX (the first touch's X position), otherwise uses mouseX (mouse cursor position)
let currentY = touches.length > 0 ? touchY : mouseY;
Same logic for vertical position: prioritizes touch over mouse
frequency = map(currentX, 0, width, 100, 1000);
Maps currentX from the range [0, width] to [100, 1000]; far left = 100 Hz (low), far right = 1000 Hz (high)
osc.freq(frequency);
Updates the oscillator's frequency to the newly calculated value; the sound pitch changes immediately
let amplitudeLevel = map(currentY, 0, height, 0.5, 0);
Maps currentY from [0, height] to [0.5, 0]; top of screen = loud (0.5), bottom = silent (0); inverted because smaller Y is higher on screen
osc.amp(amplitudeLevel, 0.1);
Sets the oscillator amplitude and smoothly transitions to it over 0.1 seconds; prevents abrupt volume jumps that cause audio artifacts
density = map(currentY, 0, height, 10, 50);
Maps the same Y position to grid density; moving up increases circle count, moving down decreases it
rotateX(radians(rotationX));
Rotates the entire canvas around the X-axis based on device tilt (pitch); radians() converts degrees to radians that rotate() expects
rotateY(radians(rotationY));
Rotates the entire canvas around the Y-axis based on device tilt (roll); stacks with rotateX() for combined 3D effect
colorMode(HSB);
Switches color mode from RGB to HSB (Hue-Saturation-Brightness); now fill(hue, saturation, brightness) instead of fill(r, g, b)
let spacing = width / density;
Calculates the pixel distance between adjacent grid points; higher density = smaller spacing
for (let x = -width / 2; x <= width / 2; x += spacing) {
Outer loop iterates over X coordinates from left edge (-width/2) to right edge (width/2) with step size = spacing
for (let y = -height / 2; y <= height / 2; y += spacing) {
Inner loop iterates over Y coordinates from top (-height/2) to bottom (height/2); together, these create a grid of (x,y) points
let n = noise(x * 0.01, y * 0.01, frameCount * 0.005);
Calculates Perlin noise; x and y scaled by 0.01 to zoom into smooth region, frameCount * 0.005 adds slow animation over time
let circleSize = map(n, 0, 1, 5, spacing * 0.8);
Maps noise value [0, 1] to circle diameter [5, spacing*0.8]; low noise = tiny circles, high noise = large circles
let hue = map(n, 0, 1, 0, 360);
Maps noise value [0, 1] to hue [0, 360] degrees; creates a color gradient where each point's color depends on its noise value
let brightness = map(amp.getLevel(), 0, 0.5, 50, 100);
Reads the oscillator's current amplitude (0 to ~0.5) and maps it to brightness (50 to 100); louder sound = brighter circles
fill(hue, 80, brightness);
Sets the fill color in HSB mode: hue (color), saturation (80 = vibrant), brightness (responsive to sound)
circle(x, y, circleSize);
Draws a filled circle at grid position (x, y) with diameter circleSize; the position, size, and brightness are all determined by noise and sound
colorMode(RGB);
Switches back to RGB color mode so the debug text uses familiar red/green/blue values

windowResized()

windowResized() is a built-in p5.js function that fires automatically whenever the browser window is resized. It's essential for responsive sketches. Without it, the canvas would stay a fixed size and leave unused screen space, or be cut off if the window shrinks.

// Function called when the preview panel is resized
function windowResized() {
  resizeCanvas(windowWidth, windowHeight, WEBGL); // Resize canvas responsively
  ortho(); // Re-apply 2D projection after resize
}
Line-by-line explanation (2 lines)
resizeCanvas(windowWidth, windowHeight, WEBGL);
Resizes the canvas to match the current window dimensions; WEBGL mode is maintained so 3D features continue to work
ortho();
Re-applies orthographic projection after the resize; necessary because WEBGL sometimes resets its projection settings

mousePressed()

Modern browsers require user interaction (a click or touch) before audio can play. userStartAudio() unlocks the audio system; without it, the oscillator would produce no sound. This function fires on the first mousepress or touch, so the user hears sound immediately after their first interaction.

// Function to start the audio context on user interaction
// This is required by modern browsers for audio playback
function mousePressed() {
  userStartAudio(); // [p5.js Reference: userStartAudio()](https://p5js.org/reference/p5/userStartAudio/)
}
Line-by-line explanation (1 lines)
userStartAudio();
Initializes the browser's audio context; required by modern security policies that prevent websites from playing audio without user permission

touchStarted()

touchStarted() is the touch-device equivalent of mousePressed(). It fires when a finger touches the screen. Returning false prevents the browser from interpreting the touch as a scroll or zoom gesture, giving full control to the sketch. Both mousePressed() and touchStarted() call userStartAudio(), ensuring audio works on both desktop and mobile.

// Function to handle touch interaction (equivalent to mousePressed for touch devices)
function touchStarted() {
  userStartAudio(); // Start audio context on touch
  return false; // Prevent default touch actions (like scrolling)
}
Line-by-line explanation (2 lines)
userStartAudio();
Same as in mousePressed(): initializes audio context on first touch
return false;
Prevents the browser's default touch behavior (scrolling, zooming, etc.), so the sketch captures all touch input

📦 Key Variables

osc p5.Oscillator

The sine wave audio oscillator object; its frequency and amplitude are controlled by mouse/touch position

let osc; // Declared globally, initialized as new p5.Oscillator('sine') in setup()
amp p5.Amplitude

Measures the oscillator's real-time sound level; used to modulate circle brightness for audio-visual sync

let amp; // Declared globally, initialized as new p5.Amplitude() in setup()
frequency number

Current oscillator frequency in Hz; mapped from mouseX and updated every frame

let frequency = 440; // Initial value (musical A4 note)
density number

Controls the grid's density (circles per row); mapped from mouseY and updated every frame

let density = 20; // Initial value; ranges from 10 to 50 based on interaction
currentX number

Current horizontal position from either touch (touchX) or mouse (mouseX)

let currentX = touches.length > 0 ? touchX : mouseX;
currentY number

Current vertical position from either touch (touchY) or mouse (mouseY)

let currentY = touches.length > 0 ? touchY : mouseY;
amplitudeLevel number

Mapped from currentY; ranges 0.5 (top) to 0 (bottom); controls oscillator volume

let amplitudeLevel = map(currentY, 0, height, 0.5, 0);
spacing number

Pixel distance between adjacent grid points; calculated as width / density

let spacing = width / density;
n number

Perlin noise value (0–1) for each grid point; used to vary circle size, hue, and animation

let n = noise(x * 0.01, y * 0.01, frameCount * 0.005);
circleSize number

Diameter of each circle; mapped from Perlin noise value

let circleSize = map(n, 0, 1, 5, spacing * 0.8);
hue number

Color hue (0–360 degrees); mapped from Perlin noise value in HSB mode

let hue = map(n, 0, 1, 0, 360);
brightness number

Circle brightness (50–100 in HSB); mapped from current audio amplitude for sound-reactive effect

let brightness = map(amp.getLevel(), 0, 0.5, 50, 100);

🔧 Potential Improvements (6)

Here are some ways this code could be enhanced:

BUG draw() — Perlin noise scaling

The scaling factors (x * 0.01, y * 0.01) are hardcoded and do not adapt to canvas size; on very large or very small windows, the pattern may look stretched or compressed

💡 Scale noise input by canvas dimensions: noise(x * 0.01 / width, y * 0.01 / height, frameCount * 0.005) to keep the pattern visually consistent at any resolution

PERFORMANCE draw() — Nested loops with map() calls

Calling map() inside the nested loop thousands of times per frame is inefficient; map() is a simple arithmetic operation but repeated calls still add overhead

💡 Cache frequently recalculated values outside the loops (e.g., compute spacing and brightness once per frame, not per circle)

STYLE draw() — Global variable mutations

The draw() function modifies global variables (frequency, density) every frame; this makes the code harder to test and reason about because function behavior depends on hidden state

💡 Consider using local variables or passing state explicitly to clarify dependencies; alternatively, document that these globals are intentional UI state holders

FEATURE draw() — Debug info

Debug lines are commented out, but the sketch offers no on-screen feedback by default; users cannot see frequency, amplitude, or rotation values

💡 Add a toggle (e.g., press 'd' key) to show/hide debug info; or display a minimal indicator (e.g., a frequency label) when the sketch starts

BUG windowResized() — ortho() call

ortho() is called in both setup() and windowResized(), but the WEBGL coordinate system can behave unexpectedly on some browsers after resize if projection parameters are not fully reset

💡 Also call resetMatrix() in windowResized() to clear any transformation state left over from the previous frame: ortho(); resetMatrix();

FEATURE draw() — Color mode switching

The sketch switches between HSB and RGB modes multiple times per frame; this is unnecessary and can be optimized

💡 Keep color mode as HSB throughout draw() and render debug text only if needed, using HSB values (e.g., hue 0 = red, saturation/brightness as needed) or render text to a separate layer

🔄 Code Flow

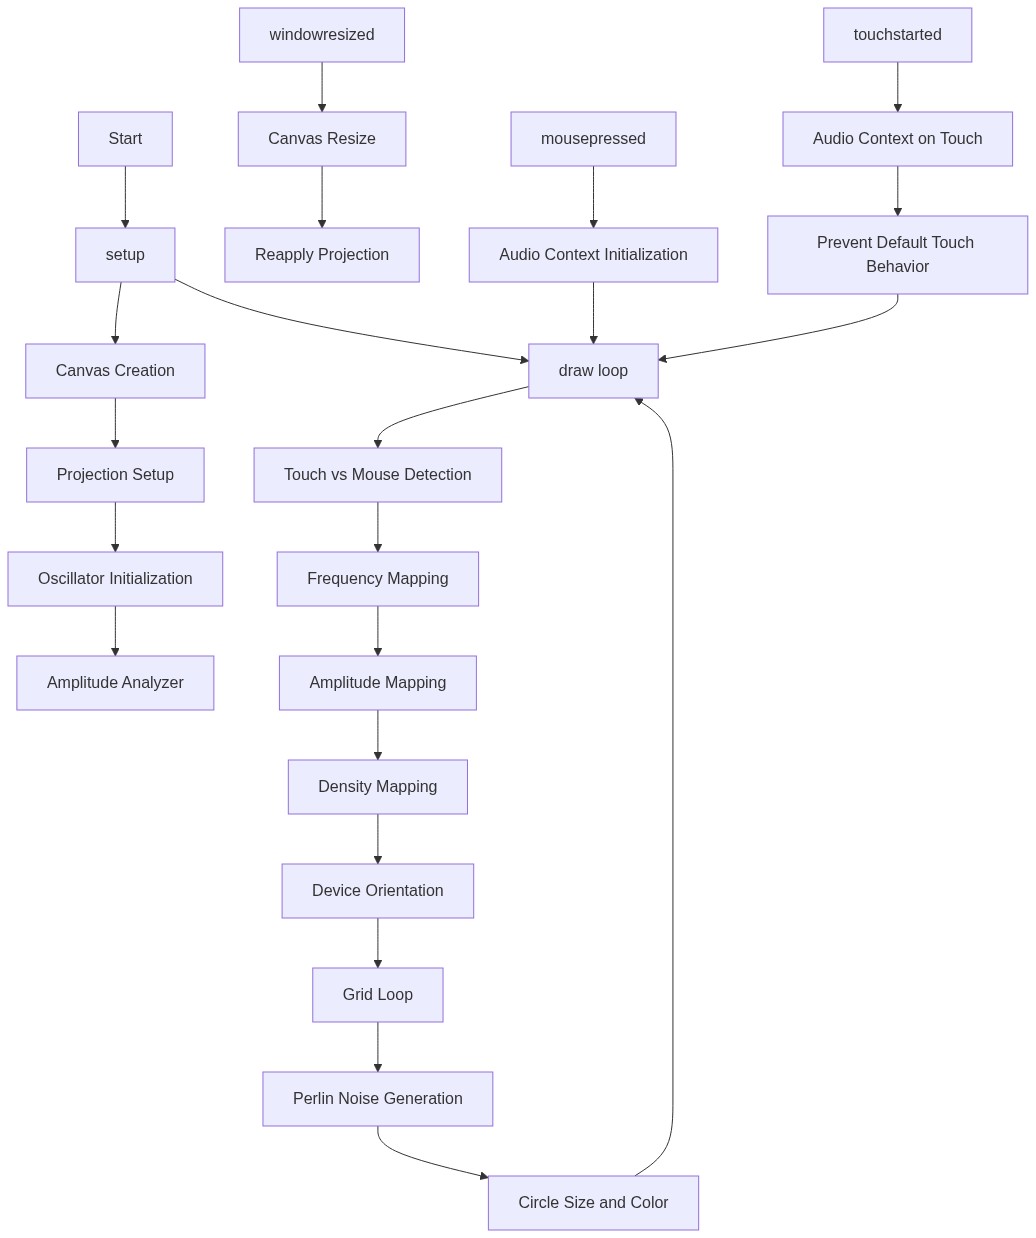
Code flow showing setup, draw, windowresized, mousepressed, touchstarted

💡 Click on function names in the diagram to jump to their code

graph TD start[Start] --> setup[setup] setup --> canvas-creation[Canvas Creation] setup --> oscillator-init[Oscillator Initialization] setup --> amplitude-init[Amplitude Meter Setup] setup --> draw[draw loop] click setup href "#fn-setup" click canvas-creation href "#sub-canvas-creation" click oscillator-init href "#sub-oscillator-init" click amplitude-init href "#sub-amplitude-init" draw --> input-mapping[Input-to-Sound Mapping] draw --> amplitude-mapping[Y Position to Volume] draw --> grid-loop[Nested Grid Generation] draw --> audio-visual-sync[Brightness to Audio Amplitude] click draw href "#fn-draw" click input-mapping href "#sub-input-mapping" click amplitude-mapping href "#sub-amplitude-mapping" click grid-loop href "#sub-grid-loop" click audio-visual-sync href "#sub-audio-visual-sync" grid-loop --> perlin-noise[Perlin Noise Sampling] click perlin-noise href "#sub-perlin-noise" windowresized[windowResized] --> setup click windowresized href "#fn-windowresized" mousepressed[mousePressed] --> userStartAudio[Unlock Audio System] touchstarted[touchStarted] --> userStartAudio click mousepressed href "#fn-mousepressed" click touchstarted href "#fn-touchstarted"

❓ Frequently Asked Questions

What visual effects can I expect from the p5.js creative coding sketch?

This sketch generates dynamic visual patterns that react to user interactions, creating an engaging audio-visual experience.

How can I interact with the sketch to influence sound and visuals?

Users can interact by moving their mouse or touching the screen, which alters the sound frequency and amplitude, as well as the visual grid density.

What creative coding concepts are showcased in this sketch?

The sketch demonstrates generative audio-visual synthesis, utilizing oscillators and real-time user input to create a responsive and immersive experience.

Preview

Sketch 2026-02-16 07:50 - p5.js creative coding sketch preview
Sketch Preview
Code flow diagram showing the structure of Sketch 2026-02-16 07:50 - Code flow showing setup, draw, windowresized, mousepressed, touchstarted
Code Flow Diagram