
SKIP - xelsed.ai

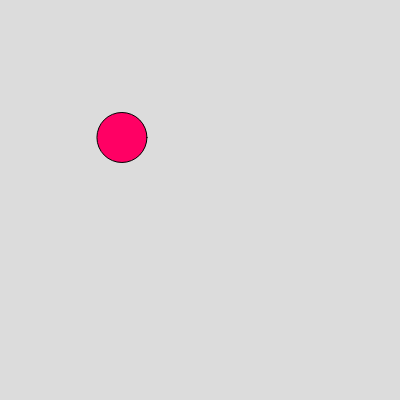
This sketch draws a single pink circle that continuously orbits around the center of the browser window in a smooth elliptical loop. The motion is created purely with trigonometry (sine and cosine) tied to the animation's frame count, and the canvas automatically resizes to fill the entire browser window.

🧪 Try This!

Experiment with the code by making these changes:

  1. Speed up the orbit — Increasing the 0.05 multiplier makes frameCount's angle grow faster, so the circle races around its loop instead of drifting slowly.
  2. Widen the orbit path — Changing width / 4 and height / 4 to width / 2 and height / 2 makes the circle swing almost all the way to the edges of the screen.
  3. Fade instead of erase — Using a semi-transparent background instead of a solid one leaves faint trails behind the circle as it moves, revealing its full orbital path over time.
Prefer the full editor? Open it there →

📖 About This Sketch

This sketch creates a single pink circle that glides in a continuous, wobbling loop around the center of the screen. The hypnotic orbit is produced entirely by feeding the ever-increasing frameCount variable into the cos() and sin() trigonometric functions, offsetting the circle's x and y position from the canvas center. It's also a fully responsive sketch: the canvas fills the whole browser window and reshapes itself instantly if that window is resized.

The code is intentionally minimal, with just three functions: setup() to create the canvas, draw() to animate the circle every frame, and windowResized() to keep the canvas full-screen. By studying it you'll learn how sine and cosine can turn a simple counter into circular motion, and how p5.js lets you build sketches that adapt to any screen size.

⚙️ How It Works

  1. When the sketch loads, setup() runs once and creates a canvas that exactly matches the width and height of the browser window
  2. Every frame, draw() paints a light gray background over the entire canvas, erasing the previous frame's circle
  3. draw() calculates a new x position using cos(frameCount * 0.05) and a new y position using sin(frameCount * 0.05), both scaled and offset so the motion happens around the center of the screen
  4. Because frameCount increases by 1 every frame (roughly 60 times per second), the angle passed into cos() and sin() constantly grows, which traces out a smooth circular/elliptical path over time
  5. A pink circle is drawn at the newly calculated (x, y) position, creating the illusion of continuous orbiting motion
  6. If the browser window is resized, windowResized() fires automatically and calls resizeCanvas() so the canvas - and therefore the orbit's center and radius - always matches the current window size

🎓 Concepts You'll Learn

Animation loop (draw)Trigonometric motion with sin() and cos()frameCount as an animation clockResponsive full-window canvaswindowResized event handlingCoordinate offsets from canvas center

📝 Code Breakdown

setup()

setup() runs exactly once when the sketch starts, before draw() begins looping. It's the right place to size your canvas and set any starting values, though this sketch has no other state to initialize.

function setup() {
  createCanvas(windowWidth, windowHeight);
}
Line-by-line explanation (1 lines)
createCanvas(windowWidth, windowHeight);
Creates a drawing canvas that exactly matches the current width and height of the browser window, so the sketch fills the whole screen.
draw()

draw() runs continuously - by default about 60 times per second - and this sketch uses that repetition together with frameCount (which increases by 1 every frame) to feed a constantly growing angle into cos() and sin(). Since those functions naturally oscillate between -1 and 1, multiplying and offsetting them turns a simple counter into smooth, repeating circular motion without needing any manual physics.

🔬 Both lines multiply frameCount by 0.05 to control speed, and width/4 or height/4 to control how far the circle strays from center. What happens if you change width / 4 to width / 8 in the x line only? What if you make the 0.05 in the y line much smaller than the x line's, like 0.01?

  let x = width / 2 + width / 4 * cos(frameCount * 0.05);
  let y = height / 2 + height / 4 * sin(frameCount * 0.05);
function draw() {
  background(220);
  fill(255, 0, 100);
  let x = width / 2 + width / 4 * cos(frameCount * 0.05);
  let y = height / 2 + height / 4 * sin(frameCount * 0.05);
  circle(x, y, 50);
}
Line-by-line explanation (5 lines)

🔧 Subcomponents:

calculation Horizontal Orbit Position let x = width / 2 + width / 4 * cos(frameCount * 0.05);

Computes the circle's x-coordinate by offsetting from the horizontal center using cosine, so it oscillates left and right over time.

calculation Vertical Orbit Position let y = height / 2 + height / 4 * sin(frameCount * 0.05);

Computes the circle's y-coordinate by offsetting from the vertical center using sine, so it oscillates up and down over time.

background(220);
Repaints the entire canvas with light gray every frame, which erases the previous frame's circle so only the current one is visible (this is what creates smooth animation instead of a trail).
fill(255, 0, 100);
Sets the fill color used for shapes drawn afterward - here an RGB value that produces a bright pink.
let x = width / 2 + width / 4 * cos(frameCount * 0.05);
Starts at the canvas's horizontal center (width / 2) and adds an offset of up to width / 4 pixels, scaled by cos() of an ever-growing angle, making x swing back and forth.
let y = height / 2 + height / 4 * sin(frameCount * 0.05);
Starts at the canvas's vertical center and adds an offset scaled by sin() of the same growing angle, making y swing up and down in sync with x to trace a circular path.
circle(x, y, 50);
Draws a circle with a 50-pixel diameter at the freshly calculated (x, y) position for this frame.

windowResized()

windowResized() is a special p5.js function that p5 automatically calls whenever the browser window changes size. Pairing it with resizeCanvas() is the standard way to build sketches that always fill the screen, on any device.

function windowResized() {
  resizeCanvas(windowWidth, windowHeight);
}
Line-by-line explanation (1 lines)
resizeCanvas(windowWidth, windowHeight);
Resizes the existing canvas to match the browser window's new width and height whenever the window is resized, keeping the sketch full-screen.

🔧 Potential Improvements (4)

Here are some ways this code could be enhanced:

FEATURE entire sketch

The project description promises a microphone visualizer built with p5.AudioIn, but the actual code never creates an AudioIn object or reads any audio input - it's just a circle orbiting on a timer.

💡 Add a p5.AudioIn instance, call .start() in setup() (usually inside a user gesture like mousePressed for browser permission rules), and use .getLevel() each frame to drive the circle's size or color based on real microphone volume.

STYLE draw()

Magic numbers like 0.05, 50, and the RGB color values are hard-coded directly in draw(), making them harder to find and tune later.

💡 Pull these into named constants or global variables near the top of the file, e.g. let orbitSpeed = 0.05; let circleSize = 50; so their purpose is clear and they're easy to adjust in one place.

BUG draw() orbit radius uses width/4 and height/4

Because the orbit radius is recalculated from width and height every frame, resizing the browser window instantly changes the orbit's radius, which can cause a visible jump in the circle's path right at the moment of resize.

💡 Store the orbit radius (or the canvas size used to compute it) in a variable that only updates inside windowResized(), so the radius stays stable between resize events instead of recalculating every single frame.

STYLE draw()

No noStroke() is called, so the circle is drawn with p5's default black outline, which can look visually noisy against the pink fill.

💡 Add noStroke(); in setup() (or at the top of draw()) for a cleaner, flat-colored circle, or explicitly set a stroke color if an outline is desired.

🔄 Code Flow

Code flow showing setup, draw, windowresized

💡 Click on function names in the diagram to jump to their code

graph TD start[Start] --> setup[setup] setup --> draw[draw loop] draw --> xcalculation[x-calculation] draw --> ycalculation[y-calculation] xcalculation --> draw ycalculation --> draw click setup href "#fn-setup" click draw href "#fn-draw" click xcalculation href "#sub-x-calculation" click ycalculation href "#sub-y-calculation"

❓ Frequently Asked Questions

What visual effects can I expect from the SKIP - XeLseDai sketch?

This sketch creates a dynamic visualizer that displays a moving circle, which oscillates in position based on a cosine and sine function, creating a rhythmic effect.

How can I interact with the SKIP - XeLseDai microphone visualizer?

While the current sketch does not include direct user interaction, it captures microphone input, allowing for potential future enhancements to visualize audio levels.

What creative coding concepts are showcased in the SKIP - XeLseDai sketch?

The sketch demonstrates fundamental techniques in p5.js, such as using trigonometric functions for motion and responsive canvas resizing.

Preview

SKIP - xelsed.ai - p5.js creative coding sketch preview
Sketch Preview
Code flow diagram showing the structure of SKIP - xelsed.ai - Code flow showing setup, draw, windowresized
Code Flow Diagram