
theme of the day may 8 2026

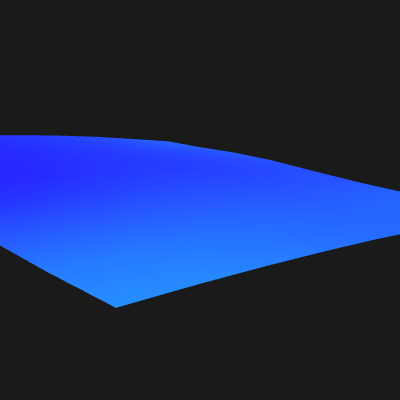
This sketch creates an interactive 3D landscape of flowing, rippling waves colored in rainbow gradients. By moving your mouse, you tilt and rotate the mesh to reveal the organic motion from different angles, combining Perlin noise, trigonometric waves, and WEBGL 3D rendering.

🧪 Try This!

Experiment with the code by making these changes:

  1. Make the mesh gigantic — Lower scale values create finer mesh detail—this will make individual waves more visible and smooth but the sketch will render slower
  2. Paint with grays instead of rainbows — Setting saturation to 0 removes all color, leaving only brightness variation—the waves become monochrome but the geometry is still visible
  3. Dramatic wave heights — Increasing the amplitude multiplier creates mountain-like peaks instead of gentle ripples—the mesh will reach much higher and lower
  4. Super-fast color cycling — Larger multipliers in the time-based hue shift cycle through the rainbow spectrum faster—colors will pulse and change rapidly
  5. Inverse rotation controls — Swapping the rotation angle ranges reverses mouse control—moving the mouse will now tilt and spin the mesh in the opposite direction
Prefer the full editor? Open it there →

📖 About This Sketch

This sketch renders a landscape of endless flowing waves in vibrant rainbow colors that ripple and shift like liquid light. The visual magic comes from three p5.js techniques working together: WEBGL mode for smooth per-vertex color gradients, Perlin noise to create organic flowing motion, and trigonometric waves (sin/cos) layered together to produce realistic rippling surfaces. Mouse movement tilts and rotates the entire mesh in 3D space, letting you float above the landscape and discover new patterns.

The code is organized around a clever triangle-strip mesh system: instead of drawing individual shapes, it builds long ribbons of connected triangles that are incredibly efficient to render. You'll learn how vertex coloring, time-based animation, and 3D transforms work together. By studying this sketch, you'll understand how professional 3D visualizations combine noise, waves, and transformations to create mesmerizing effects.

⚙️ How It Works

  1. When the sketch loads, setup() creates a WEBGL canvas (which enables 3D rendering) and switches to HSB color mode so hues can cycle smoothly through rainbows. It calculates a grid of rows and columns based on the screen size and a scale value.
  2. Every frame, draw() maps your mouse position to two rotation angles: horizontal mouse movement rotates the mesh left/right, vertical mouse movement tilts it up/down.
  3. The mesh is translated so it rotates around its center point, and time is advanced by -0.02 to drive the animation forward.
  4. A nested loop builds the mesh as a series of triangle strips: for each row, it alternates between top and bottom vertices, calculating height (Z) and color (Hue) at each point using two helper functions.
  5. getZ() combines sine waves, cosine waves, and Perlin noise scaled by time to create smooth rippling motion with organic variation.
  6. getH() uses Perlin noise to map each point to a hue value, then shifts the entire color palette over time so gradients flow and cycle smoothly.

🎓 Concepts You'll Learn

WEBGL 3D renderingTriangle strip meshPerlin noise animationVertex coloring3D transformations (rotateX, rotateZ, translate)HSB color mode and hue cyclingInteractive mouse control

📝 Code Breakdown

setup()

setup() runs once when the sketch starts. WEBGL mode is crucial here—it's what enables smooth color interpolation across triangles and fast 3D transforms. HSB color mode makes cycling through rainbows mathematically simple: you just increment hue and it wraps around naturally.

function setup() {
  // We MUST use WEBGL mode to get smooth per-vertex color interpolation
  createCanvas(windowWidth, windowHeight, WEBGL);
  
  // HSB makes it much easier to cycle through rainbow gradients
  colorMode(HSB, 360, 100, 100, 100);

  // Make the grid 1.5x larger than screen so edges don't show when rotated
  let w = windowWidth * 1.5;
  let h = windowHeight * 1.5;

  cols = floor(w / scl);
  rows = floor(h / scl);

  // Calculate exact pixel dimensions of the generated grid
  realW = cols * scl;
  realH = rows * scl;
  
  noStroke(); // Hide wireframe grid lines for a smooth gradient surface
}
Line-by-line explanation (6 lines)

🔧 Subcomponents:

function-call WEBGL mode initialization createCanvas(windowWidth, windowHeight, WEBGL);

Creates a 3D canvas that supports vertex-by-vertex color interpolation and smooth transformations

function-call HSB color setup colorMode(HSB, 360, 100, 100, 100);

Switches from RGB to HSB (hue, saturation, brightness) so rainbow color cycles are easier to calculate

calculation Grid dimensions cols = floor(w / scl); rows = floor(h / scl); realW = cols * scl; realH = rows * scl;

Calculates how many vertices fit in the grid and the exact pixel size for centering the mesh

createCanvas(windowWidth, windowHeight, WEBGL);
Creates a full-window canvas in WEBGL mode, which is required for smooth 3D rendering and per-vertex color blending
colorMode(HSB, 360, 100, 100, 100);
Switches to HSB color mode (Hue 0-360, Saturation and Brightness 0-100) so you can cycle through rainbow gradients smoothly
let w = windowWidth * 1.5; let h = windowHeight * 1.5;
Makes the mesh 1.5 times larger than the visible screen so rotations don't expose empty edges
cols = floor(w / scl); rows = floor(h / scl);
Divides the width and height by the scale value to determine how many grid points fit horizontally and vertically
realW = cols * scl; realH = rows * scl;
Calculates the exact final mesh dimensions so it can be centered at (0, 0) for proper rotation
noStroke();
Disables drawing of triangle edges, leaving only smooth color gradients without visible grid lines
draw()

draw() is where the magic happens. The triangle strip approach is key: instead of drawing individual shapes, you create long ribbons of connected triangles, which is far more efficient. The nested loop structure (y outside, x inside) ensures that each row of strips covers the full width. The per-vertex color assignment (fill before each vertex) is what creates the smooth gradient illusion across the mesh—WEBGL blends the colors automatically.

🔬 These two lines convert your mouse position into rotation angles. What happens if you swap the PI / 2.2 and PI / 8 values (flip them)? Will the tilt direction reverse?

  let rotX = map(my, 0, height, PI / 2.2, PI / 8); // Tilt up/down
  let rotZ = map(mx, 0, width, -PI / 4, PI / 4);   // Rotate left/right

🔬 This inner loop draws two vertices for each column—the pattern alternates between top and bottom vertices to build the triangle strip. What if you change the saturation from 85 to 0? Will the colors become grayscale?

    for (let x = 0; x < cols; x++) {
      
      // Calculate data for the top vertex of the current strip
      let z1 = getZ(x, y, time);
      let h1 = getH(x, y, time);
      fill(h1, 85, 100); // Set color (Hue, Saturation, Brightness)
      vertex(x * scl, y * scl, z1);

      // Calculate data for the bottom vertex of the current strip (y + 1)
      let z2 = getZ(x, y + 1, time);
      let h2 = getH(x, y + 1, time);
      fill(h2, 85, 100);
      vertex(x * scl, (y + 1) * scl, z2);
function draw() {
  background(10); // Very dark gray

  // 1. Interactive Camera Control
  // Map mouse position to viewing angles safely
  let mx = constrain(mouseX, 0, width);
  let my = constrain(mouseY, 0, height);

  let rotX = map(my, 0, height, PI / 2.2, PI / 8); // Tilt up/down
  let rotZ = map(mx, 0, width, -PI / 4, PI / 4);   // Rotate left/right

  rotateX(rotX);
  rotateZ(rotZ);

  // 2. Center the Mesh over (0,0,0) so it rotates properly
  translate(-realW / 2, -realH / 2);

  // Advance time for the flowing animation
  time -= 0.02;

  // 3. Generate the Triangle Strip Mesh
  for (let y = 0; y < rows - 1; y++) {
    beginShape(TRIANGLE_STRIP);
    for (let x = 0; x < cols; x++) {
      
      // Calculate data for the top vertex of the current strip
      let z1 = getZ(x, y, time);
      let h1 = getH(x, y, time);
      fill(h1, 85, 100); // Set color (Hue, Saturation, Brightness)
      vertex(x * scl, y * scl, z1);

      // Calculate data for the bottom vertex of the current strip (y + 1)
      let z2 = getZ(x, y + 1, time);
      let h2 = getH(x, y + 1, time);
      fill(h2, 85, 100);
      vertex(x * scl, (y + 1) * scl, z2);
    }
    endShape();
  }
}
Line-by-line explanation (15 lines)

🔧 Subcomponents:

calculation Mouse-to-rotation mapping let rotX = map(my, 0, height, PI / 2.2, PI / 8); // Tilt up/down let rotZ = map(mx, 0, width, -PI / 4, PI / 4); // Rotate left/right

Converts mouse position into safe rotation angles—moving your mouse up/down tilts the mesh, left/right spins it

for-loop Triangle strip generation for (let y = 0; y < rows - 1; y++) { beginShape(TRIANGLE_STRIP); for (let x = 0; x < cols; x++) {

Creates horizontal strips of triangles efficiently—each strip alternates between top and bottom vertices

calculation Per-vertex height and color let z1 = getZ(x, y, time); let h1 = getH(x, y, time); fill(h1, 85, 100); vertex(x * scl, y * scl, z1);

Calculates the Z position (height) and hue color for each vertex using noise and waves, then draws it

background(10); // Very dark gray
Clears the canvas with a very dark color each frame so previous frames don't leave trails
let mx = constrain(mouseX, 0, width); let my = constrain(mouseY, 0, height);
Clamps mouse coordinates to stay within the canvas bounds so rotations don't jump if your mouse leaves the window
let rotX = map(my, 0, height, PI / 2.2, PI / 8); // Tilt up/down
Maps vertical mouse position to a rotation angle: moving your mouse down tilts the mesh toward you, moving up tilts it away
let rotZ = map(mx, 0, width, -PI / 4, PI / 4); // Rotate left/right
Maps horizontal mouse position to a spin angle: moving your mouse right rotates the mesh clockwise, left counter-clockwise
rotateX(rotX); rotateZ(rotZ);
Applies the two rotation transforms to the entire mesh—order matters: X rotates first, then Z is applied to the result
translate(-realW / 2, -realH / 2);
Shifts the mesh so its center is at the origin (0, 0) before rotations—without this, it would rotate around a corner
time -= 0.02;
Decreases time each frame to drive the flowing animation forward—the getZ and getH functions use this value to shift waves and colors
for (let y = 0; y < rows - 1; y++) {
Loops through each row except the last (rows-1 prevents going out of bounds when accessing y+1)
beginShape(TRIANGLE_STRIP);
Starts a triangle strip—an efficient way to draw connected triangles where each new vertex forms a triangle with the previous two
for (let x = 0; x < cols; x++) {
Loops through all columns, so each strip spans the full width of the mesh
let z1 = getZ(x, y, time); let h1 = getH(x, y, time);
Calculates the Z height and hue color for the top vertex of the strip at position (x, y)
fill(h1, 85, 100); vertex(x * scl, y * scl, z1);
Sets the color to the calculated hue (saturation and brightness stay constant) and draws the vertex at its 3D position
let z2 = getZ(x, y + 1, time); let h2 = getH(x, y + 1, time);
Calculates the Z height and hue color for the bottom vertex of the strip at position (x, y+1)
fill(h2, 85, 100); vertex(x * scl, (y + 1) * scl, z2);
Sets the color and draws the bottom vertex—together, the four most recent vertices form two triangles
endShape();
Closes the triangle strip for this row and moves to the next

getZ()

getZ() is the formula that creates the height map. By layering sine, cosine, and Perlin noise, you get waves that feel both mathematical (the trig functions) and natural (the noise). The sin and cos create a directional cross-hatch pattern, while noise breaks the perfect geometry into something organic. This is a classic technique in procedural generation.

🔬 These three lines create different wave patterns. What if you change the 0.15 multipliers to 0.3? Will the waves become more frequent (more peaks)?

  let wave1 = sin(x * 0.15 + t);
  let wave2 = cos(y * 0.15 + t);
  let n = noise(x * 0.05, y * 0.05, t * 0.2) * 2 - 1;
function getZ(x, y, t) {
  // Combine sin, cos, and noise for an organic liquid ripple
  let wave1 = sin(x * 0.15 + t);
  let wave2 = cos(y * 0.15 + t);
  let n = noise(x * 0.05, y * 0.05, t * 0.2) * 2 - 1;
  
  return (wave1 + wave2 + n) * 45; // 45 is the wave height/amplitude
}
Line-by-line explanation (4 lines)

🔧 Subcomponents:

calculation Horizontal sine wave let wave1 = sin(x * 0.15 + t);

Creates a repeating wave pattern across the X axis that shifts over time

calculation Vertical cosine wave let wave2 = cos(y * 0.15 + t);

Creates a perpendicular wave pattern across the Y axis, layered with the sine wave

calculation Organic Perlin noise let n = noise(x * 0.05, y * 0.05, t * 0.2) * 2 - 1;

Adds smooth random variation that makes waves feel natural instead of perfectly mathematical

let wave1 = sin(x * 0.15 + t);
Calculates a sine wave based on the X position and current time—the 0.15 controls how spread out the wave peaks are, and adding t makes the wave shift each frame
let wave2 = cos(y * 0.15 + t);
Calculates a perpendicular cosine wave based on the Y position—combining sine and cosine creates a cross-hatched ripple pattern
let n = noise(x * 0.05, y * 0.05, t * 0.2) * 2 - 1;
Generates Perlin noise (smooth randomness) that varies by position and time; the 0.05 and 0.2 control detail level; multiplying by 2 and subtracting 1 gives a range of -1 to 1
return (wave1 + wave2 + n) * 45; // 45 is the wave height/amplitude
Adds all three components together and multiplies by 45 to create the final Z height—45 controls how tall the waves appear

getH()

getH() calculates hue (the color) at each vertex. Perlin noise gives you spatial variation so nearby points have similar colors, while the time-based shift pushes the entire palette around the color wheel—that's what creates the flowing rainbow effect. Using % 360 ensures the hue wraps back to red after reaching violet.

🔬 The abs(t)*20 part cycles through the rainbow over time. What if you change 20 to 50? Will the colors shift faster through the spectrum?

  let n = noise(x * 0.03, y * 0.03, t * 0.1);
  // Abs(t)*20 smoothly pushes the whole palette forward over time
  return (n * 360 + abs(t) * 20) % 360;
function getH(x, y, t) {
  // Map noise into a slowly shifting color spectrum
  let n = noise(x * 0.03, y * 0.03, t * 0.1);
  // Abs(t)*20 smoothly pushes the whole palette forward over time
  return (n * 360 + abs(t) * 20) % 360; 
}
Line-by-line explanation (2 lines)

🔧 Subcomponents:

calculation Spatial color noise let n = noise(x * 0.03, y * 0.03, t * 0.1);

Generates smooth color variation across space that changes over time

calculation Time-based hue rotation return (n * 360 + abs(t) * 20) % 360;

Cycles the entire rainbow palette forward over time, creating a flowing color shift

let n = noise(x * 0.03, y * 0.03, t * 0.1);
Generates Perlin noise based on position and time; the 0.03 and 0.1 control how quickly colors change across space and time
return (n * 360 + abs(t) * 20) % 360;
Multiplies noise by 360 to get a hue value (in HSB, 0-360 is the full rainbow), adds a time-based shift, and uses % 360 to wrap values back into the valid range

windowResized()

windowResized() is a p5.js built-in function that fires automatically when the browser window is resized. It ensures that the mesh stays properly sized and centered even if the viewer resizes their window. This is a small but important detail that makes the sketch feel polished.

function windowResized() {
  resizeCanvas(windowWidth, windowHeight);
  // Re-calculate grid bounds just in case aspect ratio changed drastically
  let w = windowWidth * 1.5;
  let h = windowHeight * 1.5;
  cols = floor(w / scl);
  rows = floor(h / scl);
  realW = cols * scl;
  realH = rows * scl;
}
Line-by-line explanation (3 lines)

🔧 Subcomponents:

function-call Canvas resize resizeCanvas(windowWidth, windowHeight);

Updates the canvas size to match the new window dimensions

calculation Grid recalculation cols = floor(w / scl); rows = floor(h / scl); realW = cols * scl; realH = rows * scl;

Recalculates grid dimensions to fit the new canvas size

resizeCanvas(windowWidth, windowHeight);
Updates the p5.js canvas to match the new window size when the browser is resized
let w = windowWidth * 1.5; let h = windowHeight * 1.5;
Recalculates the oversized mesh dimensions so it still covers 1.5x the visible window
cols = floor(w / scl); rows = floor(h / scl); realW = cols * scl; realH = rows * scl;
Recalculates how many grid points fit in the new dimensions

📦 Key Variables

scl number

Grid scale—the distance in pixels between adjacent mesh vertices; lower values create finer detail but slower rendering

let scl = 65;
cols number

Number of columns in the mesh grid; calculated based on canvas width and scl

cols = floor(windowWidth * 1.5 / scl);
rows number

Number of rows in the mesh grid; calculated based on canvas height and scl

rows = floor(windowHeight * 1.5 / scl);
realW number

Exact width of the generated mesh in pixels; used to center the mesh at the origin

realW = cols * scl;
realH number

Exact height of the generated mesh in pixels; used to center the mesh at the origin

realH = rows * scl;
time number

Animation timer that drives the flowing wave and color shift effects; decremented each frame

let time = 0;
mouseX number

p5.js built-in variable tracking the current horizontal mouse position; used to control rotation

let mx = constrain(mouseX, 0, width);
mouseY number

p5.js built-in variable tracking the current vertical mouse position; used to control tilt

let my = constrain(mouseY, 0, height);

🔧 Potential Improvements (4)

Here are some ways this code could be enhanced:

PERFORMANCE draw() mesh generation

The entire mesh is recalculated and redrawn every frame even though the grid structure never changes—only the height and color values need updating

💡 For production use, consider using a GPU shader (GLSL) or a pre-computed vertex buffer that only updates heights and colors, leaving the connectivity static. This would be 5-10x faster on large grids.

STYLE getZ() and getH()

Magic numbers like 0.15, 0.05, 0.03, 0.1, 45, and 20 are hard-coded and unclear in purpose—they control the feel of the animation but aren't obvious to someone reading the code

💡 Define these as named constants at the top of the file: const WAVE_FREQ = 0.15; const NOISE_SCALE_Z = 0.05; const WAVE_AMPLITUDE = 45; etc. This makes the code self-documenting and easier to tune.

FEATURE Entire sketch

There is no keyboard control to adjust parameters in real-time—experimenting requires editing and reloading the code

💡 Add keyboard listeners to adjust scl, wave_amplitude, or time_speed on the fly. For example: if (keyCode === UP) { scl += 1; } to let users explore variations interactively without coding.

BUG windowResized()

When the window is resized, the mesh is recalculated but the camera rotation angles are preserved, which can cause visual discontinuity if the aspect ratio changes dramatically

💡 After recalculating grid bounds, reset the rotation angles or smoothly lerp them to neutral values so the transition feels smooth.

🔄 Code Flow

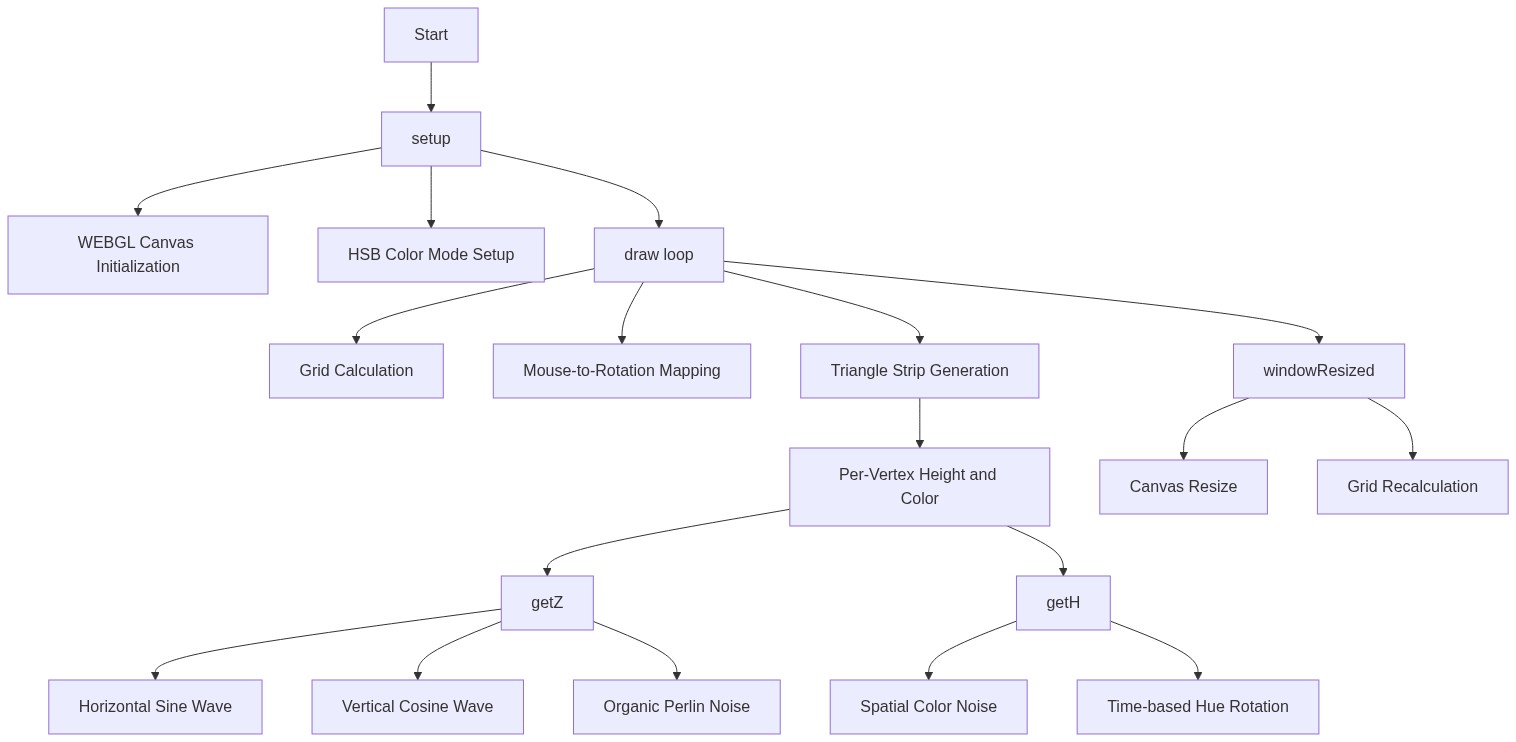
Code flow showing setup, draw, getz, geth, windowresized

💡 Click on function names in the diagram to jump to their code

graph TD start[Start] --> setup[setup] setup --> webgl-canvas[WEBGL Canvas Initialization] setup --> hsb-colormode[HSB Color Mode Setup] setup --> draw[draw loop] click setup href "#fn-setup" click webgl-canvas href "#sub-webgl-canvas" click hsb-colormode href "#sub-hsb-colormode" draw --> grid-calculation[Grid Calculation] draw --> mouse-mapping[Mouse-to-Rotation Mapping] draw --> triangle-strip-loop[Triangle Strip Generation] click draw href "#fn-draw" click grid-calculation href "#sub-grid-calculation" click mouse-mapping href "#sub-mouse-mapping" click triangle-strip-loop href "#sub-triangle-strip-loop" triangle-strip-loop --> vertex-calculation[Per-Vertex Height and Color] click vertex-calculation href "#sub-vertex-calculation" vertex-calculation --> getz[getZ] vertex-calculation --> geth[getH] click getz href "#fn-getz" click geth href "#fn-geth" getz --> sine-wave[Horizontal Sine Wave] getz --> cosine-wave[Vertical Cosine Wave] getz --> perlin-noise[Organic Perlin Noise] click sine-wave href "#sub-sine-wave" click cosine-wave href "#sub-cosine-wave" click perlin-noise href "#sub-perlin-noise" geth --> position-noise[Spatial Color Noise] geth --> hue-shift[Time-based Hue Rotation] click position-noise href "#sub-position-noise" click hue-shift href "#sub-hue-shift" draw --> windowresized[windowResized] windowresized --> canvas-resize[Canvas Resize] windowresized --> grid-recalc[Grid Recalculation] click windowresized href "#fn-windowresized" click canvas-resize href "#sub-canvas-resize" click grid-recalc href "#sub-grid-recalc"

❓ Frequently Asked Questions

What visual experience does the p5.js sketch 'theme of the day may 8 2026' create?

The sketch generates a mesmerizing, rainbow-colored landscape that flows like liquid light, inviting viewers to explore shifting gradients and waves.

How can users interact with the 'theme of the day may 8 2026' sketch?

Users can move their mouse to tilt and rotate the scene, revealing new perspectives of the vibrant, animated landscape.

What creative coding techniques are demonstrated in this p5.js sketch?

The sketch showcases interactive camera control, smooth per-vertex color interpolation, and real-time animation through time-based height calculations.

Preview

theme of the day may 8 2026 - p5.js creative coding sketch preview
Sketch Preview
Code flow diagram showing the structure of theme of the day may 8 2026 - Code flow showing setup, draw, getz, geth, windowresized
Code Flow Diagram